
APOLLO
11 OPERATIONS HANDBOOK BLOCK II SPACECRAFT
VOLUME
l SPACECRAFT DESCRIPTION
Electrical
Power Subsystem Block Diagram
MAJOR
COMPONENT /SUBSYSTEM DESCRIPTION
Cryogenic
Storage Subsystem (Oxygen) Schematic
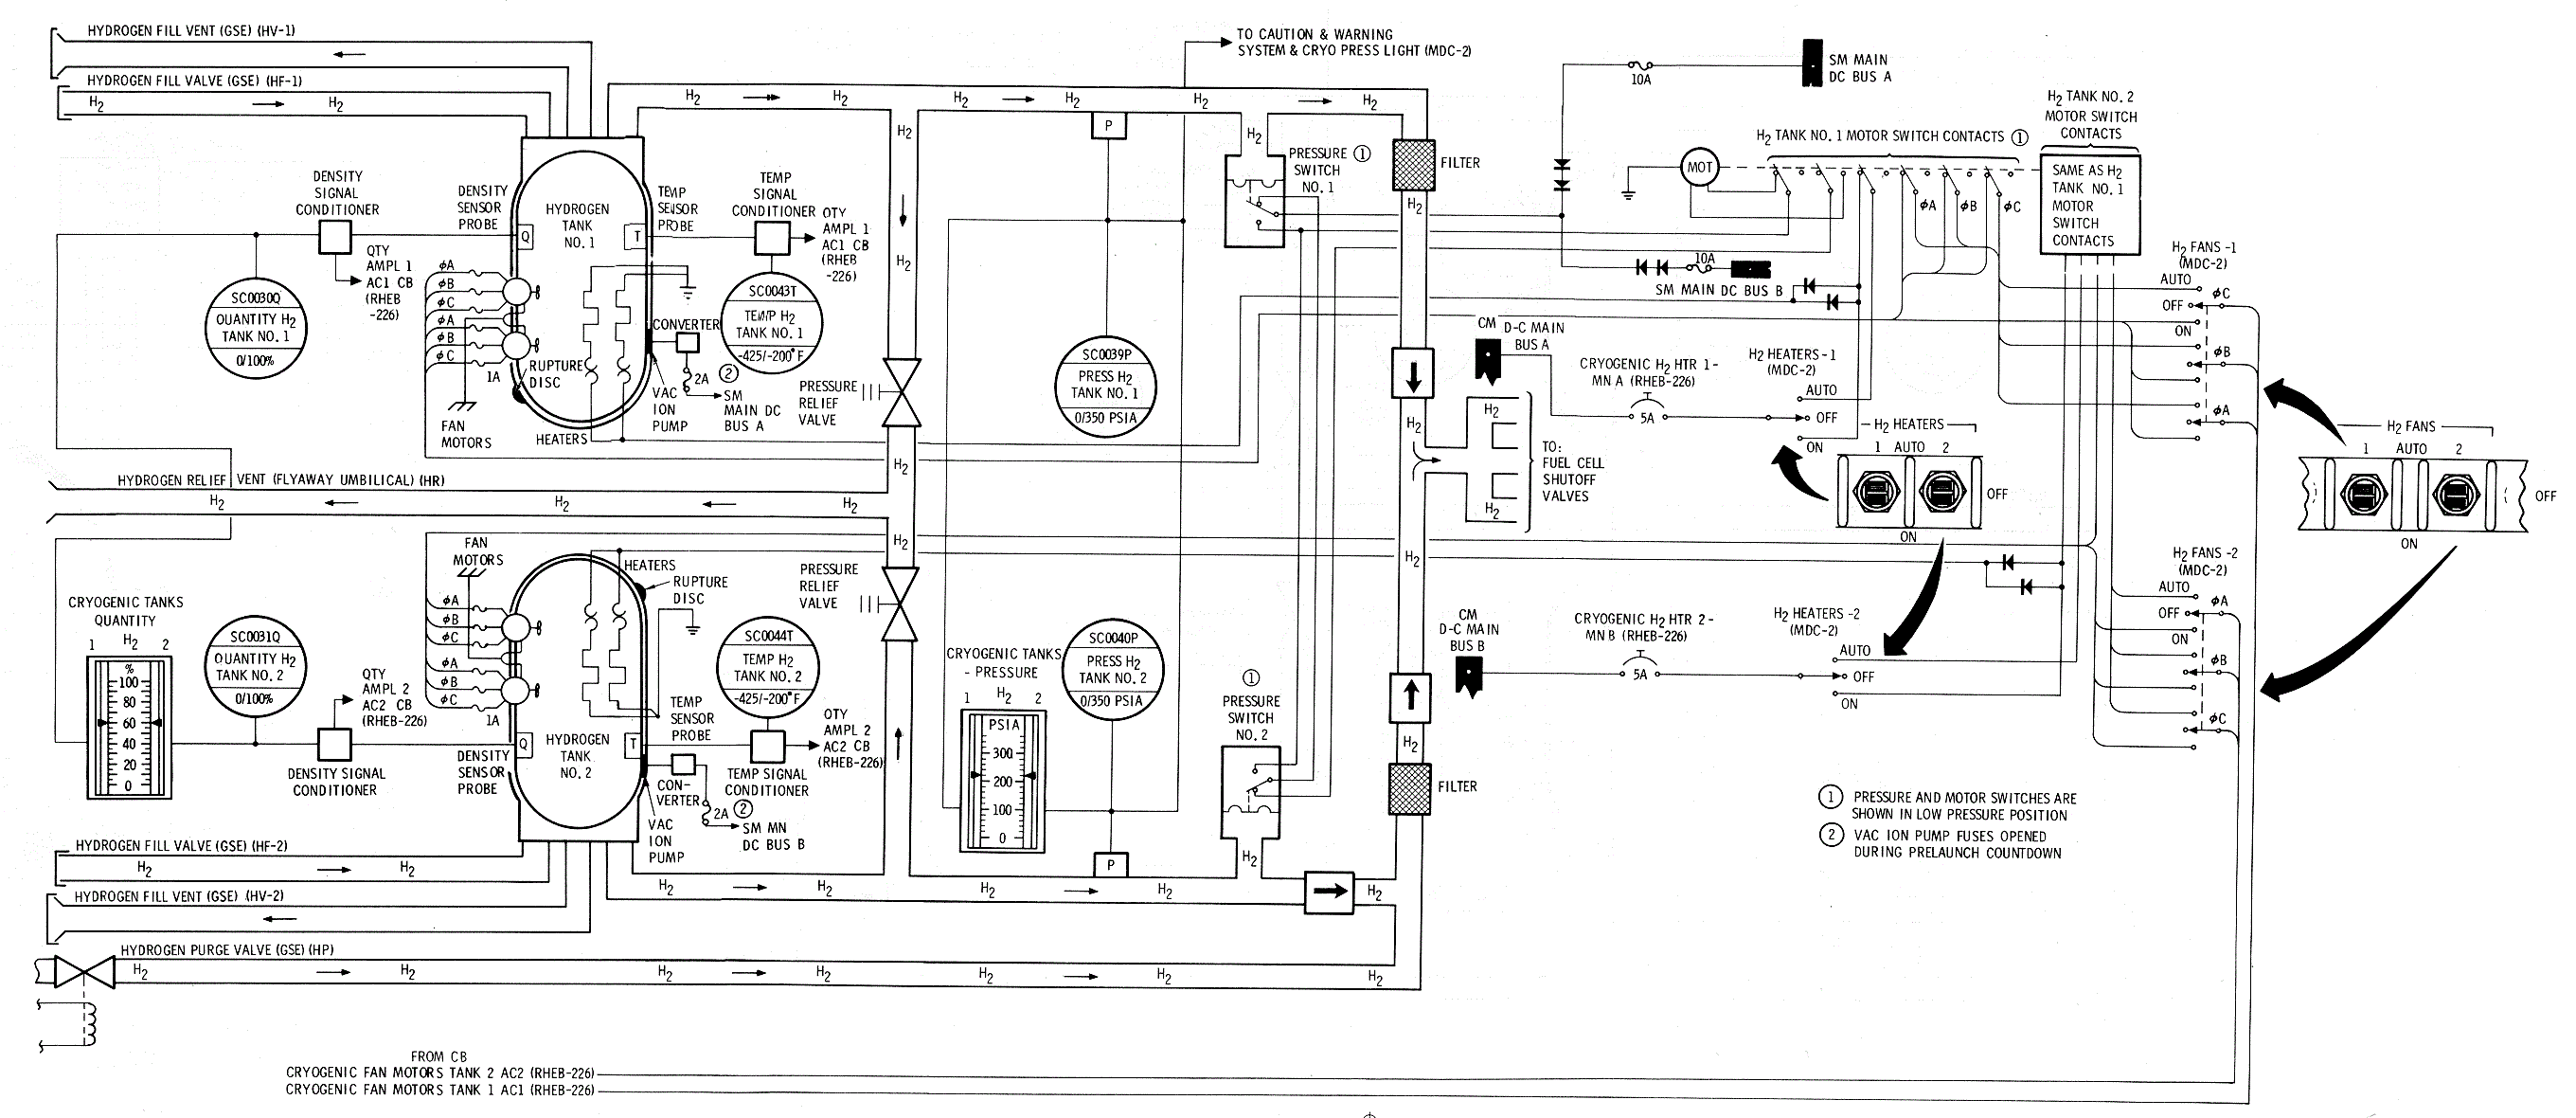
Cryogenic
Storage Subsystem (Hydrogen) Schematic
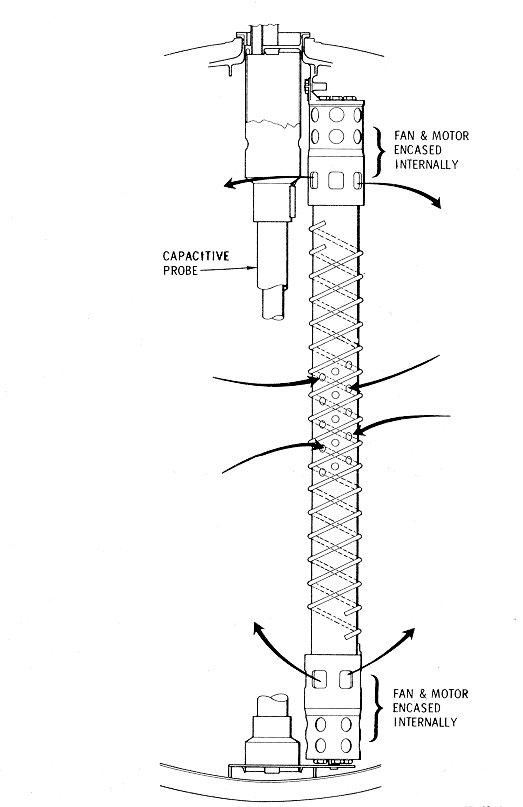
Cryogenic
Pressurization and Quantity Measurement Devices Diagram
OXYGEN
GAS PURITY LEVEL (% BY VOLUME) Graph
H2
Gas Purity Effect on Purge Interval Graph
Battery
Charger and CM D-C Bus Control Circuits Schematic
Battery
Charger Output (Amperes) Graph
D-C
Power Distribution Diagram
D-C
and A-C Voltage Sensing Schematic
A-C
Power Distribution Diagram
OPERATIONAL
LIMITATIONS AND RESTRICTIONS
COMMAND
MODULE INTERIOR LIGHTING
CM
Integral/Numerics Illumination System Diagram
Integral and Numerics Panel Lighting Schematic
The electrical power subsystem (EPS) consists of the
equipment and reactants required to supply the electrical energy sources,
power generation and controls , power conversion and conditioning, and
power distribution to the electrical buses (Electrical Power Subsystem Block
Diagram). Electrical power distribution and conditioning
equipment beyond the buses is not considered a part of this subsystem.
Power is supplied to fulfill all command and service module (CSM)
requirements, as well as to the lunar module (LM) for operation of heater
circuits after transposition and docking.
Electrical Power
Subsystem Block Diagram

The EPS can be functionally divided into four major
categories:
•
Energy storage: Cryogenics
storage, entry and postlanding batteries, pyrotechnic batteries.
•
Power generation: Fuel cell power
plants.
•
Power conversion: Solid state
inverters, battery charger.
•
Power distribution: D-C and a-c
power buses, d-c and a-c sensing circuits, controls and displays.
In general, the system operates in three modes: peak,
average, and minimum mission loads. Peak loads occur during performance of
major delta V maneuvers, including boost. These are of relatively short
duration with d - c power being supplied by three fuel cell power plants
supplemented by two of three entry batteries. A-C power is supplied by two
of three inverters.
The second mode is that part of the mission when power
demands vary about the average. During these periods d-c power is supplied
by three fuel cell power plants and a -c power by one or two inverters.
During drifting flight when power requirements are at a
minimum level, d-c power is supplied by three fuel cell powerplants. A- C
power is supplied by one or two inverters. In all cases, operation of one
or two inverters is dependent on the total cryogen available. Two
-inverter operation results in a slight increase of cryogenic usage
because of a small reduction in inverter efficiency due to the lesser
loads on each inverter. However, two inverter operation precludes complete
loss of ac in the event of a n inverter failure.
The primary source of energy is provided by the
cryogenic gas storage system that provides fuel (H2) and oxidizer (02) to
the power generating system. Two hydrogen and two oxygen tanks, with the
associated controls and plumbing, are located in the service module.
Storage of reactants is accomplished under controlled cryogenic
temperatures and pressures; automatic and manual pressure control is
provided. Automatic heating of the reactants for repressurization is
dependent on energy demand by the power generating and/ or environmental
control subsystems. Manual control can be used when required.
A secondary source of energy storage is provided by
five silver oxide-zinc batteries located in the CM. Three rechargeable
entry and postlanding batteries supply sequencer logic power at all times,
supplemental d-c power for peak loads, all operating power required for
entry and postlanding, and can be connected to power either or both pyro
circuits. Two pyro batteries provide energy for activation of pyro devices
throughout all phases of a mission.
Three Bacon-type fuel cell power plants, generating
power through electrochemical reaction of H2 and 02, supply primary d-c
power to spacecraft systems until CSM separation. Each power plant is
capable of normally supplying from 400 to 1420 watts at 31 to 27 vdc (at
fuel cell terminals) to the power distribution system. During normal
operation all three power plants generate power, but two are adequate to
complete the mission. Should two of the three malfunction, one power plant
will insure successful 'mission termination; however, spacecraft loads
must be reduced to operate within the limits of a single powerplant.
Normal fuel cell connection to the distribution system
is: Fuel cell 1 to main d-c bus A; fuel cell 2 to main d-c bus A and B;
and fuel cell 3 to main d-c bus B. Manual switch control is provided for
power plant connection to the distribution system, and manual and/ or
automatic control for power plant isolation in case of a malfunction.
During the CSM separation maneuver the power plants
supply power through the SM buses to two SM jettison control sequencers.
The sequencers sustain SM RCS retrofire during CSM separation and fire the
SM positive roll RCS engines two seconds after separation to stabilize the
SM during entry. Roll engine firing is terminated 7. 5 seconds after
separation. The power plants and SM buses are isolated from the umbilical
through a SM deadface. The sequencers are connected to the SM buses when
the CM/SM SEP switch (MDC-2) is activated; separation occurs 100
milliseconds after switch activation.
Primary d-c power is converted into a-c by sol.id state
static inverters that provide 115/200-volt 400-cps 3-phase a-c power up to
1250 volt- amperes each. A-C power is connected by motor switch controls
to two a-c buses for distribution to the a-c loads. One inverter has the
capability of supplying all spacecraft primary a-c power. One inverter can
power both buses while the two remaining inverters act as redundant
sources. However, throughout the flight, each bus is powered by a separate
inverter. Provisions are made for inverter isolation in the event of
malfunctions. Inverter outputs cannot be phase synchronized, therefore
interlocked motorized switching circuits are incorporated to prevent the
connection of two inverters to the same bus.
A second conversion unit, the battery charger, assures
keeping the three entry and postlanding batteries in a fully charged
state. It is a solid state device utilizing d-c from the fuel cells and ac
from the inverter to develop charging voltage.
Distribution of d-c power is accomplished via two
redundant d-c buses in the service module which are connected to two
redundant buses in the command module through a SM deadface, the CSM
umbilical, and a CM deadface. Additional buses provided are: two d-c buses
for servicing non-essential loads; a flight bus for servicing inflight
telecommunications equipment; two battery buses for distributing power to
sequencers, gimbal motor controls, and servicing the battery relay bus for
power distribution switching; and a flight and postlanding bus for
servicing some communications equipment and the postlanding loads.
Three phase ac is distributed via two redundant a-c
buses, providing bus selection through switches in the a-c operated
component circuits.
Power to the lunar module is provided through two
umbilicals which are manually connected after completion of transposition
and docking. An average of 81 watts de is provided to continuous heaters
in the abort sensor assembly (ASA), and cycling heaters in the landing
radar, rendezvous radar, S-band antenna and inertial measurement unit
(IMU). Power consumption with all heaters operating simultaneously is
approximately 309 watts. LM floodlighting is also powered through the
umbilical for use during manned lunar module operation while docked with
the CSM.
A d-c sensing circuit monitors voltage on each main d-c
bus and an a-c sensing circuit monitors voltage on each a-c bus. The d-c
sensors provide an indication of an undervoltage by illuminating a warning
light. The a-c sensors illuminate a warning light when high- or
low-voltage limits are exceeded. In addition, the a-c sensors activate an
automatic disconnect of the inverter from the a-c bus during an
overvoltage condition. A-C overload conditions are displayed by
illumination of an overload warning light and are accompanied by a low
voltage light. Additional sensors monitor fuel cell overload and reverse
current conditions, providing an automatic disconnect, together with
visual indications of the disconnect when never either co11dition is
exceeded.
Switches, meters, lights, and talk-back indicators are
provided for controlling and monitoring all functions of the EPS.
MAJOR COMPONENT /SUBSYSTEM DESCRIPTION
The subsequent paragraphs describe the cryogenic
storage subsystem, and each of the various EPS components.
The cryogenic storage subsystem (Cryogenic Storage Subsystem
(Oxygen) and Cryogenic
Storage Subsystem (Hydrogen) Schematic) supplies hydrogen to
the EPS, and oxygen to the EPS, ECS, and for initial LM pressurization.
The two tanks in the hydrogen and oxygen systems are of sufficient size to
provide a safe return from the furthest point of the mission on the fluid
remaining in any one tank. The physical data of the cryogenic storage
subsystem are as follows:
|
Weight of usable Cryogenics (lb/Tank) |
Design Storage Pressure (psia) |
Minimum Allowable Operating Pressure (pisa) |
Approximate Flow Rate at Min dq/dm (+145 degrees F Environment)
(lb/hr 2-tanks) |
Approximate Quantities at Minimum Heater & Fan Cycling (Per
Tank) Min dq/dm) |
|
O2 – 320 (min) |
900 +/- 35 |
150 |
1.710 |
45 to 25 % |
|
H2 – 28 (min) |
245 (+15, -20) |
100 |
0.140 |
53 to 33 % |
Cryogenic
Storage Subsystem (Oxygen) Schematic
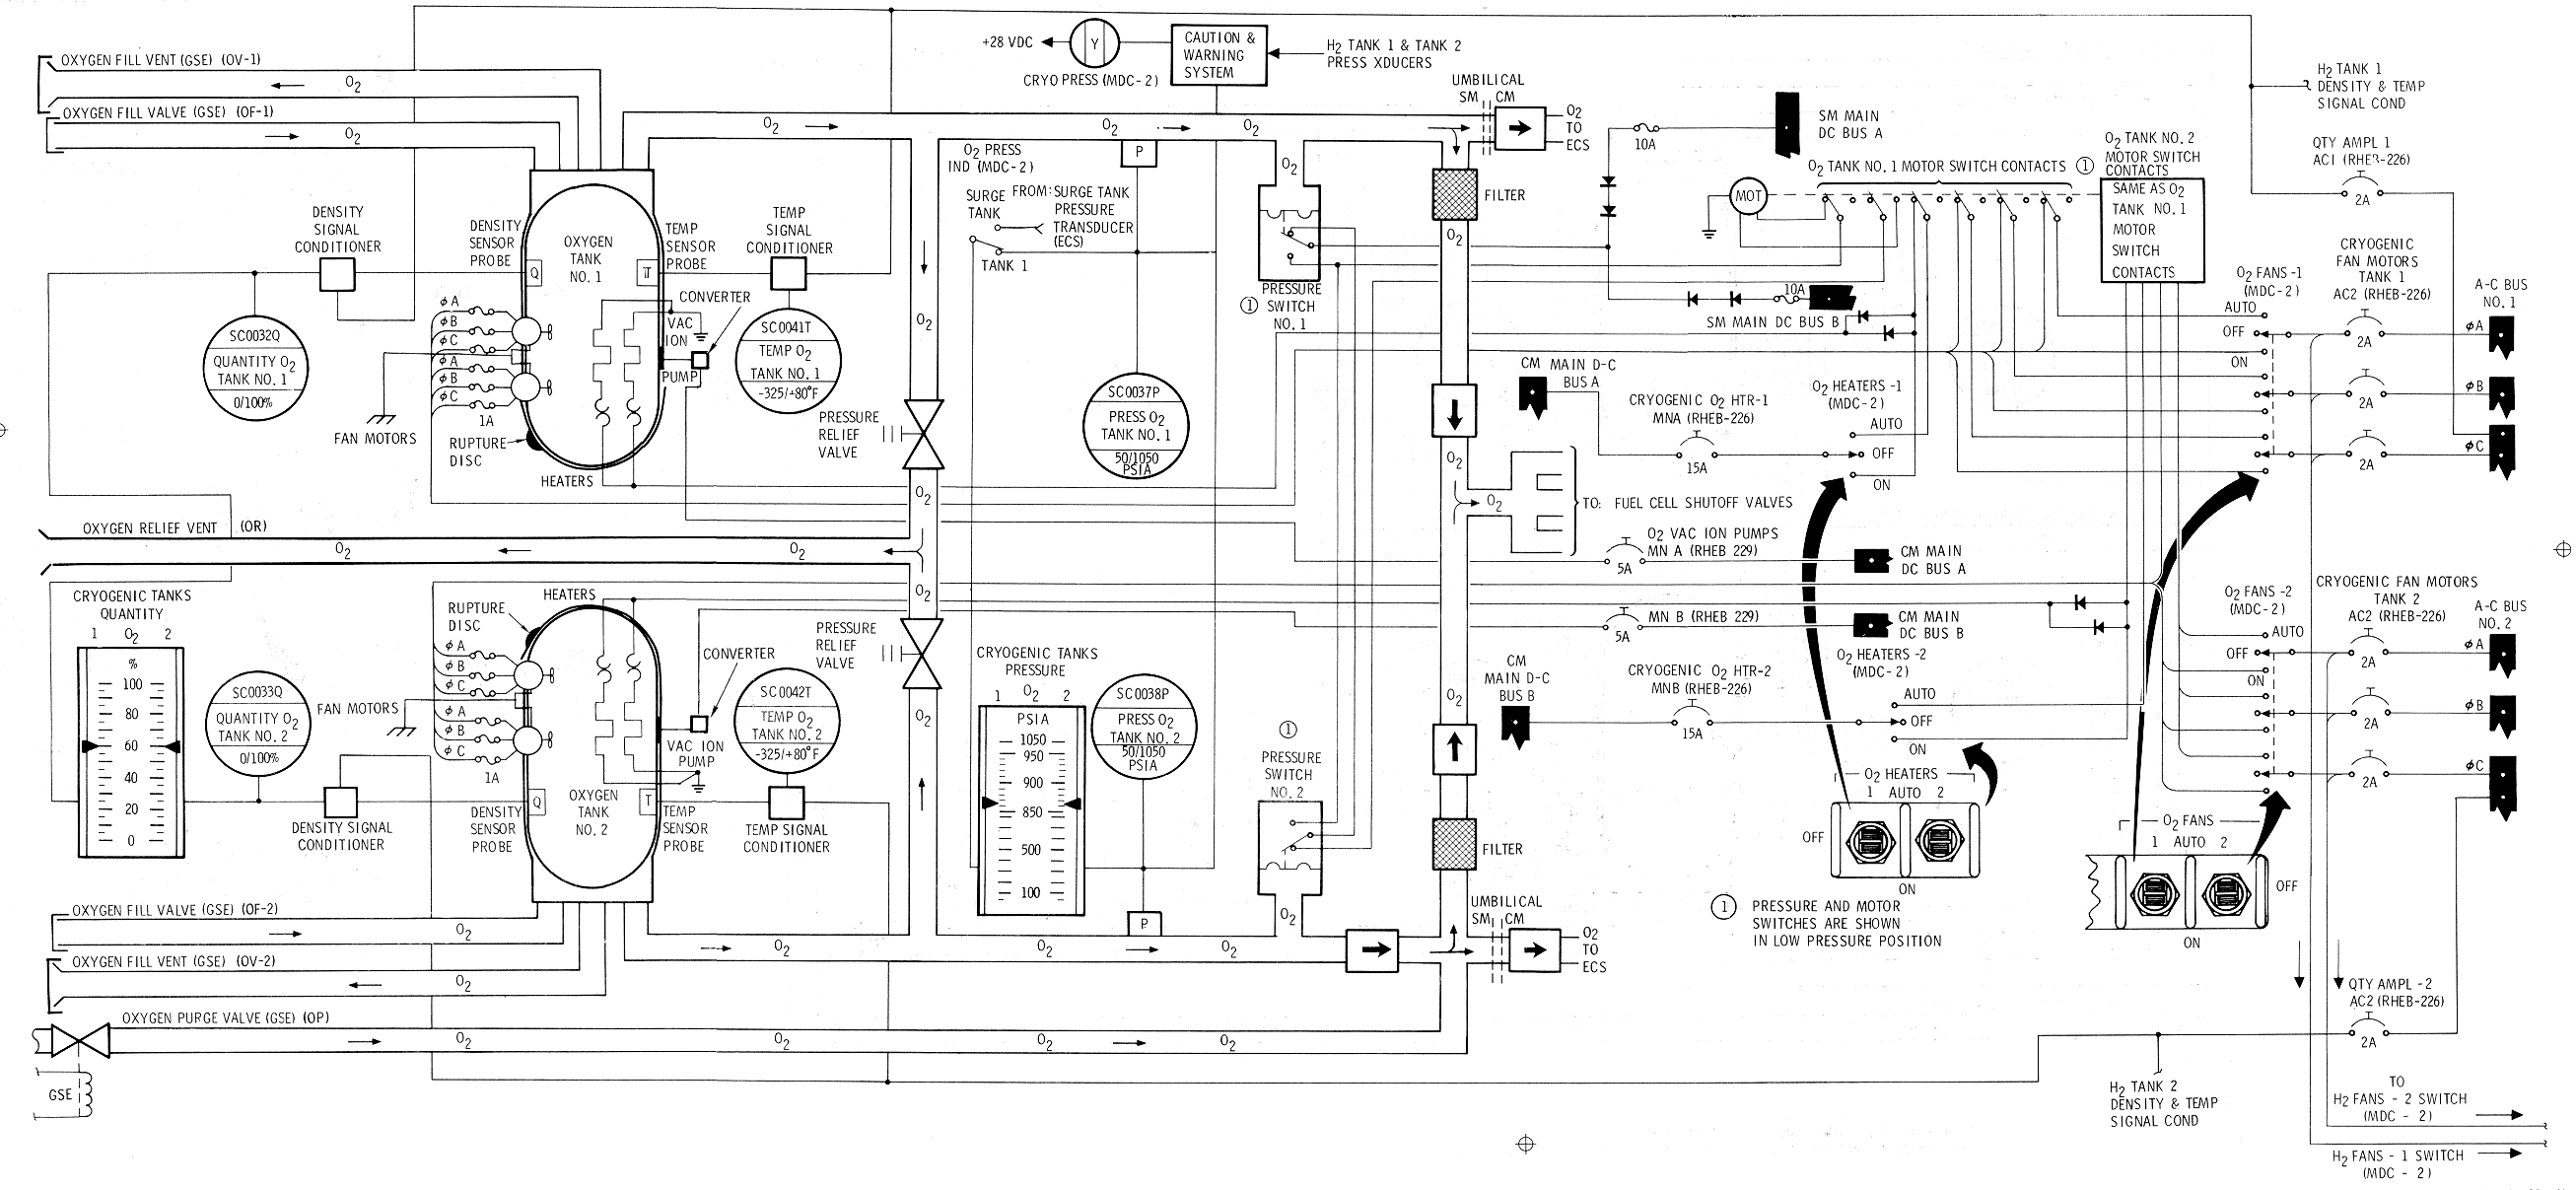
Cryogenic Storage
Subsystem (Hydrogen) Schematic
Initial pressurization from fill to operating pressures
is accomplished, by GSE. After attaining operating pressures, the
cryogenic fluids are in a single-phase condition, therefore completely
homogeneous. This avoids sloshing which could cause sudden pressure
fluctuations, possible damage to internal components, and prevents
positive mass quantity gauging. The single-phase expulsion process
continues at nearly constant pressure and increasing temperature above the
2- phase region.
Two parallel d-c heaters in each tank supply the heat
necessary to maintain design pressures. Two parallel 3-phase a-c
circulating fans circulate the fluid over the heating elements to maintain
a uniform density and decrease the probability of stratification. A
typical heater and fan installation is shown in the
Cryogenic Pressurization and
Quantity Measurement Devices Diagram
. Relief valves provide overpressure relief, check valves provide
tank isolation, and individual fuel cell shutoff valves provide isolation
of malfunctioning power plants. Filters extract particles from the flowing
fluid to protect the ECS and EPS components. The pressure transducers and
temperature probes indicate the thermodynamic state of the fluid. A
capacitive quantity probe indicates quantity of fluid remaining in the
tanks.
Cryogenic
Pressurization and Quantity Measurement Devices Diagram
Repressurization of the systems can be automatically or
manually controlled by switch selection. The automatic mode is designed to
give a single-phase reactant flow into the fuel cell and ECS feed lines at
design pressures. The heaters and fans are automatically controlled
through a pressure switch-motor switch arrangement. As pressure in the
tanks decreases, the pressure switch in each tank closes to energize the
motor switch, closing contacts in the heater and fan circuits. Both tanks
have to decrease in pressure before heater and fan circuits are energized.
When either tank reaches the upper operating pressure limit, that
respective pressure switch opens to again energize the motor switch, thus
opening the heater and fan circuits to both tanks. The Oz tank circuits
are energized at 865 psia minimum and de- energized at 935 psia maximum.
The Hz circuits energize at 225 psia minimum and de-energize at 260 psia
maximum. The most accurate quantity readout will be acquired shortly after
the fans have stopped. During all other periods partial stratification may
degrade quantity readout accuracy.
When the systems reach the point where heater and fan
cycling is at a minimum (due to a reduced heat requirement), the heat leak
of the tank is sufficient to maintain design pressures provided flow is
within the min dq/dm values shown in the preceding tabulation. This realm
of operation is referred to as the min dq/dm region. The minimum heat
requirement region for oxygen starts at approximately 45 percent quantity
in the tanks and terminate at approximately 25 percent quantity. Between
these tank quantities, minimum heater and fan cycling will occur under
normal usage. The amount of heat required for repressurization at
quantities below 25 percent starts to increase until below the 3 percent
level practically continuous heater and fan operation is required. In the
hydrogen system, the quantity levels for minimum heater and fan cycling
are between approximately 53 and 33 percent, with continuous operation
occurring at approximately 5 percent level.
Assuming a constant level flow from each tank (O2
- 1 lb/hr, Hz - O. 09 lb/hr) each successive repressurization period is of
longer duration. The periods between repressurizations lengthen as
quantity decreases from full to the minimum dq/dm level, and become
shorter as quantity decreases from the minimum dq/dm level to the residual
level. Approximate repressurization periods are shown in the following
chart, which also shows the maximum flow rate in pounds per hour from a
single tank with the repressurization circuits maintaining minimum design
pressure.
The maximum continuous flow that each cyrogenic tank
can provide at minimum design pressure is dependent on the quantity level
and the heat required to maintain that pressure. The heat required to
maintain a constant pressure decreases as quantity decreases from full to
the minimum dq/dm point. As quantity decreases beyond the minimum dq/dm
region, the heat required to maintain a constant pressure increases.
As fluid is withdrawn, a specific amount of heat is
withdrawn. When the withdrawal rate exceeds the heat that can be supplied
by the heaters, fan motors, and heat leak, there is a resultant pressure
decrease below the minimum design operating level.
The ability to sustain pressure and flow is a factor of
the amount of heat required versus the heat provided by heaters, fan
motors, and heat leak. Since heat leak characteristics of each tank vary
slightly, the flow each tank can provide will also vary to a small degree.
Heat input from heaters, fan motors, and heat leak into an o2 tank is 595.
87 Btu/hour (113. 88 watt heaters supply 389.67 Btu, 52.8 watt fan motors
supply 180. 2 Btu, and heat leak supplies 26 Btu). Heat input from similar
sources into a H2 tank is 94. 6 Btu/hr (18.6 watt heaters supply 63.48
Btu, 7 watt fan motors supply 23.89 Btu, and heat leak supplies 7.24 Btu).
These figures take into consideration the line loss between the power
source and the operating component.
|
Quantity (Percent) |
Oxygen |
Hydrogen |
||
|
Repressurization Time (Minutes) (865 to 935 psia) |
Flow at 865 psia |
Repressurization Time (Minutes) (225 to 260 psia) |
Flow at 225 psia |
|
|
100 |
4.0 |
3.56 |
20.0 |
0.38 |
|
95 |
4.3 |
3.97 |
21.0 |
0.42 |
|
90 |
4.6 |
4.55 |
22.0 |
0.46 |
|
85 |
5.0 |
5.27 |
23.0 |
0.49 |
|
80 |
5.4 |
6.02 |
24.5 |
0.52 |
|
75 |
5.7 |
7.01 |
26.5 |
0.65 |
|
70 |
6.5 |
7.94 |
28.5 |
0.76 |
|
65 |
7.4 |
9.01 |
31.0 |
0.83 |
|
60 |
8.7 |
10.80 |
33.5 |
0.87 |
|
55 |
9.6 |
12.54 |
36.0 |
0.93 |
|
50 |
10.8 |
14.19 |
39.0 |
0.97 |
|
45 |
11.5 |
15.69 |
41.0 |
0.98 |
|
40 |
12.4 |
17.01 |
41.0 |
0.97 |
|
35 |
12.6 |
17.56 |
41.0 |
0.94 |
|
30 |
13.0 |
17.56 |
40.5 |
0.91 |
|
25 |
13.1 |
16.55 |
40.5 |
0.83 |
|
20 |
13.2 |
15.48 |
42.0 |
0.71 |
|
15 |
14.5 |
12.28 |
47.0 |
0.54 |
|
10 |
17.8 |
8.76 |
58.0 |
0.37 |
|
7.5 |
21.4 |
7.09 |
71.0 |
0.23 |
|
5 |
24.0 |
5.37 |
Continuous |
0.16 |
To avoid excessive temperatures, which could be
realized during continuous heater and fan operation at extremely low
quantity levels, a thermal sensitive interlock device is in series with
each heater element. The device automatically opens the heater circuits
when internal tank shell temperatures reach +90°F, and closes the circuits
at +70°F. Assuming normal consumption, oxygen temperature will be
approximately - 157°F at mission termination, while hydrogen temperature
will be approximately -385° F.
The manual mode of operation bypasses the pressure
switches, and supplies power directly to the heaters and/or fans through
the individual control switches. It can be used 1n case of automatic
control failure, heater failure, or fan failure.
Tank pressures and quantities are monitored on meters
located on MDC-2. The caution and warning system (CRYO PRESS) will alarm,
when oxygen pressure in either tank exceeds 950 psia or falls below 800
psia. The hydrogen system alarms above 270 psia and below 220 psia. Since
a common lamp is provided, reference must be made to the individual
pressure and quantity meters (MDC-2) to determine the malfunctioning tank.
Tank pressures, quantities, and reactant temperatures of each tank are
telemetered to MSFN.
Oxygen relief valves vent at a pressure between 983 and
1010 psig and reseat at 965 psig minimum. Hydrogen relief valves vent at a
pressure between 273 and 285 psig, and reseat at 268 psig n1inimum. Full
fl ow venting occurs approximately 2 pounds above relief valve opening
pressure.
All the reactant tanks have vac-ion pumps to maintain
the integrity of the vacuum between the inner and outer shell, thus
maintaining heat leak at or below the design level. SM main d-c bus A
distributes power to the H2 tank 1 pump and bus B to the H2 tank 2 pump. F
uses provide power source protection. These fuses are removed during
prelaunch to disable the circuit for flight. Circuit breakers, O2 VAC ION
PUMPS MNA - MNB (RHEB-229), provide power source protection for the CM
main buses, which distribute power to the O2
vac-ion pumps. The circuit breakers allow u se of the O2
vac-ion pun1p circuits throughout flight, and provide a means of disabling
circuit if necessary.
The most likely period of overpressurization in the
cryogenic system will occur during operation in the minimum dq/dm region.
The possibility of overpressurization is predicated on the assumption of a
vacuum breakdown, resulting in an increase in heat leak. Also, under
certain conditions, i.e., extremely low power levels and/or a
depressurized cabin, demand may be lower than the minimum dq/dm flow
necessary. Any of the preceding conditions would result in an increase of
pressure within a tank.
Several procedures can be used to correct an
overpressure condition in the oxygen system. One is to perform an
unscheduled fuel cell purge. A second is to increase oxygen flow into the
command module by opening the ECS DIRECT O2
valve. The third is to increase electrical loads, which may not be
desirable because this method will also increase hydrogen consumption.
Increase of electrical loads is probably the least
desirable method because of the increase in demand on both reactant
systems, although an overpressure correction is required in only one
reactant system.
A requirement for an overpressure correction in both
reactant systems simultaneously is remote, since botl1 reactant systems do
not reach the minimum dq/dm region in parallel.
During all 1nissions, to retain a single tank return
capability, there 1s a requirement to maintain a balance between the two
tanks in each of the reactant systems. When a 2 to 4 percent difference is
indicated on the oxygen quantity meters (MDC- 2), the Oz HEATERS switch
(MDC-2) of the lesser tank is positioned to OFF until tank quantities
equalize. A 3 percent difference in the hydrogen quantity meters (MDC-2)
will require positioning the H2 HEATERS switch (MDC-2) of the lesser tank
to OFF until tank quantities equalize. This procedure retains the
automatic operation of the repressurization circuits, and provides for
operation of the fan motors during repressurization to retain an accurate
quantity readout in all tanks. The necessity for balancing should be
determined shortly after a repressurization cycle, since quantity readouts
will be most accurate at this time
Five silver oxide-zinc storage batteries are
incorporated in the EPS. These batteries are located in the CM lower
equipment bay.
Three rechargeable entry and postlanding batteries (A,
B, and C) power the CM systems after CSM separation and during
postlanding. Prior to CSM separation, the batteries provide a secondary
source of power while the fuel cells are the primary source. The entry
batteries are used for the following purposes:
•
Provide CM power after CSM
separation
•
Supplement fuel cell power during
peak load periods (Delta V maneuvers)
•
Provide power during emergency
operations (failure of two fuel cells)
•
Provide power for EPS control
circuitry (relays, indicators, etc.)
•
Provide sequencer logic power
•
Provide power for recovery aids
during postlanding
•
Batteries A, B, or C can power
pyro circuits by selection.
Each entry and postlanding battery is mounted in a
vented plastic case and consists of 20 silver oxide-zinc cells connected
in series. The cells are individually encased in plastic containers which
contain relief valves that open at 35±5 psig, venting during an
overpressure into the battery case. The three cases can be vented
overboard through a common manifold, the BATTERY VENT valve (RHEB-252),
and the ECS waste water dump line.
Since the BATTERY VENT is closed prior to lift-off, the
interior of the battery cases is at a pressure of one atmosphere. The
pressure is relieved after earth orbit insertion and completion of cabin
purge by positioning the control to VENT for 5 seconds. After completion
the control is closed, and pressure as read out on position 4A of the
System Test Meter (LEB-101) should remain at zero unless there is battery
outgassing. This outgassing can be caused by an internal battery failure,
an abnormal high-rate discharge, or by overcharging. If a pressure
increase is noted on the system test meter, the BATTERY VENT is positioned
to VENT for 5 seconds, and reclosed. Normal battery charging procedures
require a check of the battery manifold after completion of recharge.
Since the battery vent line is connected to the waste
water dump line, it provides a means of monitoring waste water dump line
plugging, which would be indicated by a pressure rise in the battery
manifold line when the BATTERY VENT control is positioned to VENT.
Corrective procedures for dump line plugging are found in section 2.12.
Each battery is rated at 40-ampere hours (AH) minimum
and will deliver this at a current output of 35 amps for 30 minutes and a
subsequent output of 2 amps for the remainder of the rating.
At Apollo mission loads each battery is capable of
providing 45 AH and will provide this amount after each complete recharge
cycle. However, 40 AH is used in mission planning for inflight capability,
and 45 AH for postlanding capability of a fully charged battery.
Open circuit voltage is 37. 2 volts. Sustained battery
loads are extremely light (2 to 3 watts); therefore a battery bus voltage
of approximately 34 vdc will be indicated on the spacecraft voltmeter,
except when the main bus tie switches have been activated to tie the
battery outputs to the main d-c buses. Normally only batteries A and B
will be connected to the main d-c buses. Battery C is isolated during
prelaunch by opening the MAIN A-BAT C and MAIN B-BAT C circuit breakers
(RHEB-275). Battery C will therefore provide a backup for main d-c bus
power in case of failure of battery A or B or during the time battery A or
B is being recharged. The two-battery configuration provides more
efficient use of fuel cell power during peak power loads and decreases
overall battery recharge time. The MAIN A - and MAIN B-BAT C circuit
breakers are closed prior to CSM separation or as required during recharge
of battery A or B.
Battery C, through circuit breakers BAT C to BAT BUS A
and BAT C to BAT BUS B (RHEB-250), provides backup power to the respective
battery bus in the event of failure of entry battery A or B. These circuit
breakers are normally open until a failure of battery A or B occurs. This
circuit can also be used to recharge battery A or B in the event of a
failure in the normal charging circuit.
The two pyrotechnic batteries supply power to initiate
ordnance devices in the SC. The pyrotechnic batteries are isolated from
the rest of the EPS to prevent the high-power surges in the pyrotechnic
system from affecting the EPS, and to ensure source power when required.
These batteries are not to be recharged in flight. Entry and postlanding
battery A, B, or C can be used as a redundant source of power for
initiating pyro circuits in the respective A or B pyro system, if either
pyro battery fails. This can be performed by proper manipulation of the
circuit breakers on RHEB-250. Caution must be exercised to isolate the
failed battery prior to connecting the replacement battery.
Performance characteristics of each SC battery are as
follows:
|
Battery |
Rated Capacity Per Battery |
Open Circuit Voltage {max.) |
Nominal Voltage |
Minimum Voltage |
Ambient Battery Temperature |
|
Entry and Postlanding, A, B, and C (3) |
40 amp-hrs (25 ampere rate) |
37. 8 vdc max. (37. 2 vdc in flight) |
29 vdc (35 amps load) |
27 vdc (35 amps load) |
50° to 110°F |
|
Pyro A and B (2) |
0. 75 amp- hrs (75 amps for 36 seconds) |
37. 8 vdc max. (37. 2 vdc in flight) |
23 vdc (75 amps load) |
20 vdc (75 amps load) (32 vdc open circuit) |
60 ° to 110 ° F |
NOTE: Pyro
battery load voltage is not measurable in the SC due to the extremely
short time they power pyro loads.
Each of the three Bacon-type fuel cell power plants is
individually coupled to a heat rejection (radiator) system, the hydrogen
and oxygen cryogenic storage systems, a water storage system, and a power
distribution system. A typical power plant schematic is shown in figure Fuel
Cell Schematic.
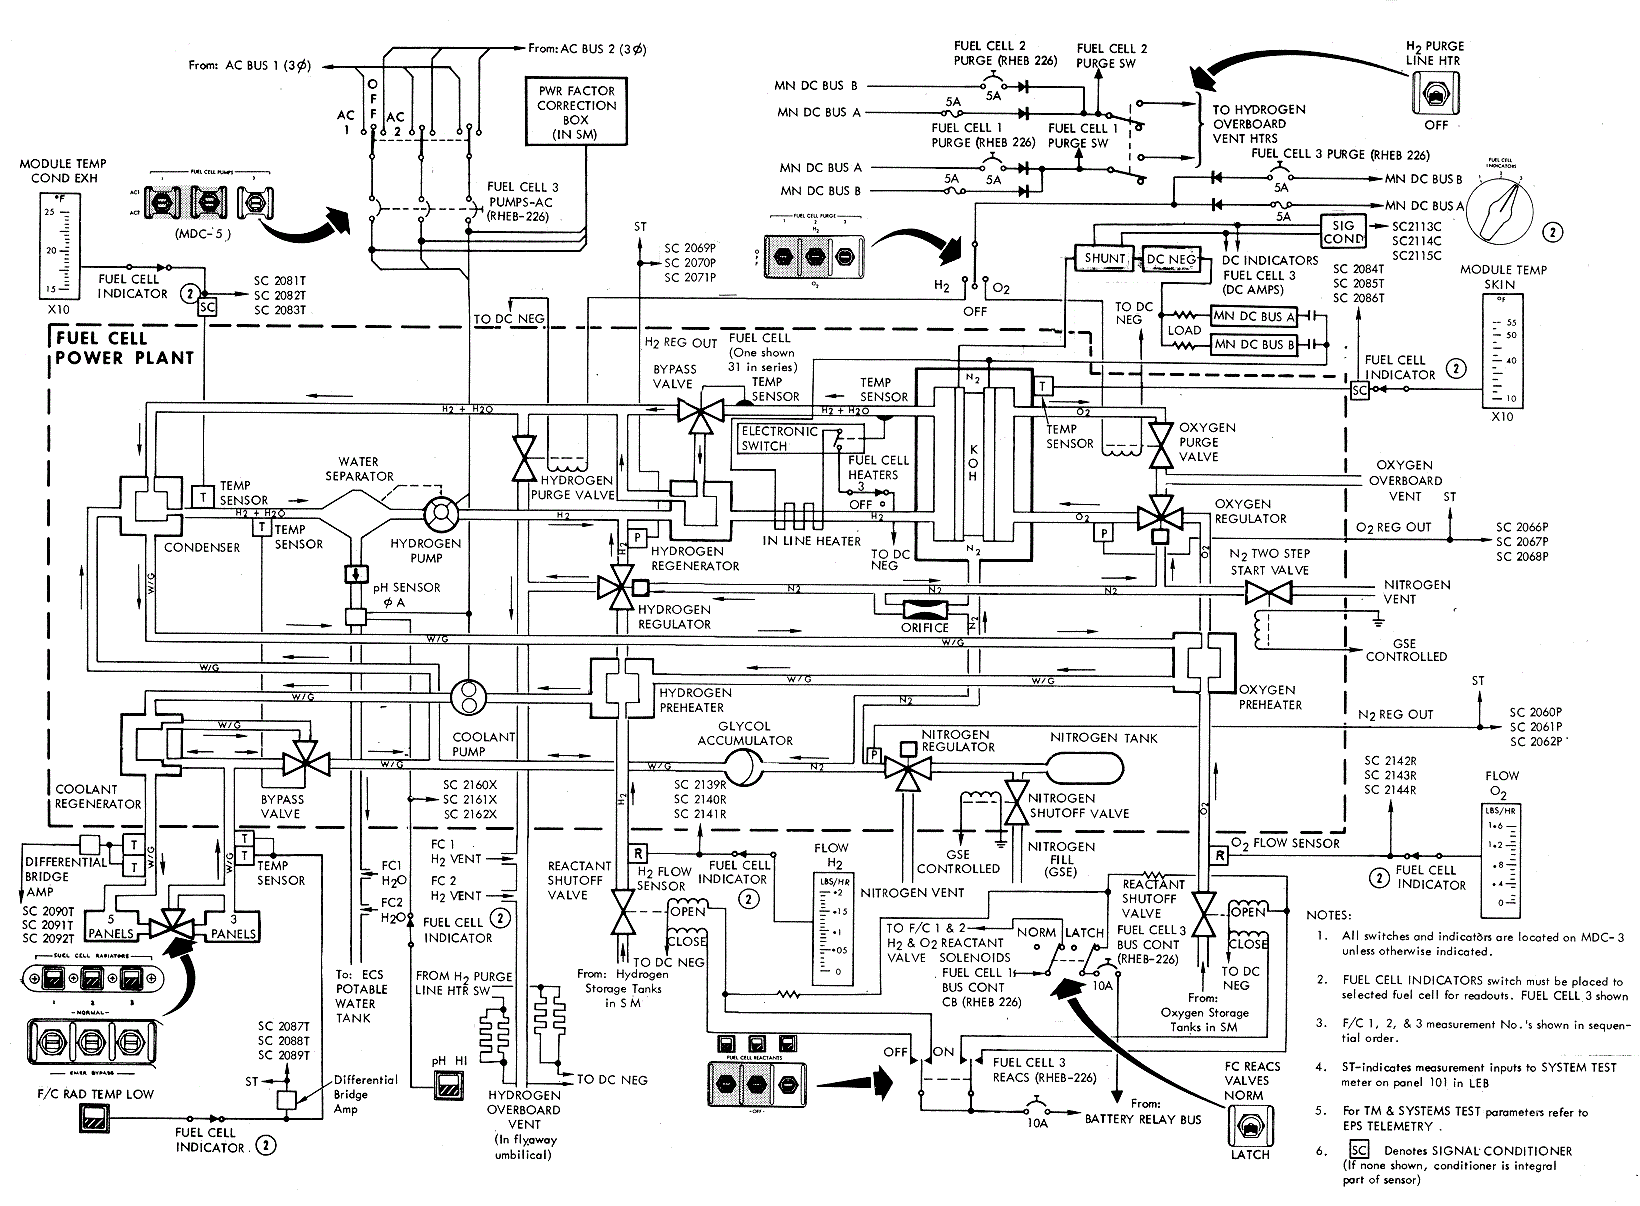
The power plants generate d-c power on demand through
an exothermic chemical reaction. The by-product water is fed to a potable
water storage tank in the CM where it is used for astronaut consumption
and for cooling purposes in the ECS. The amount of water produced is
equivalent to the power produced which is relative to the reactant
consumed.
REACTANT CONSUMPTION AND WATER PRODUCTION
|
Load (amps) |
O2 lb/hr |
H2 lb/hr |
H20 lb/hr |
cc/hr |
|
0.5 |
0.0102 |
0.001285 |
0.01149 |
5.21 |
|
1 |
0.0204 |
0.002570 |
0.02297 |
10.42 |
|
2 |
0.0408 |
0.005140 |
0.04594 |
20.84 |
|
3 |
0.0612 |
0.007710 |
0.06891 |
31.26 |
|
4 |
0.0816 |
0.010280 |
0.09188 |
41.68 |
|
5 |
0.1020 |
0.012850 |
0.11485 |
52.10 |
|
6 |
0.1224 |
0.015420 |
0.13782 |
62.52 |
|
7 |
0.1428 |
0.017990 |
0.16079 |
72.94 |
|
8 |
0.1632 |
0.020560 |
0.18376 |
83.36 |
|
9 |
0.1836 |
0.023130 |
0.20673 |
93.78 |
|
10 |
0.2040 |
0.025700 |
0.2297 |
104.20 |
|
15 |
0.3060 |
0.038550 |
0.34455 |
156.30 |
|
20 |
0.4080 |
0.051400 |
0.45940 |
208.40 |
|
25 |
0.5100 |
0.064250 |
0.57425 |
260.50 |
|
30 |
0.6120 |
0.077100 |
0.68910 |
312. 60 |
|
35 |
0.7140 |
0.089950 |
0.80395 |
364.70 |
|
40 |
0.8160 |
0.10280 |
0.91880 |
416.80 |
|
45 |
0.9180 |
0.11565 |
1.03365 |
468.90 |
|
50 |
1.0200 |
0.12850 |
1.1485 |
521.00 |
|
55 |
1.1220 |
0.14135 |
1.26335 |
573.10 |
|
60 |
1.2240 |
0.15420 |
1.3782 |
625.20 |
|
65 |
1.3260 |
0.16705 |
1.49305 |
677.30 |
|
70 |
1.4280 |
0.17990 |
1.6079 |
729.40 |
|
75 |
1.5300 |
0.19275 |
1.72275 |
781.50 |
|
80 |
1.6320 |
0.20560 |
1.83760 |
833.60 |
|
85 |
1.7340 |
0.21845 |
1.95245 |
885.70 |
|
90 |
1.8360 |
0.23130 |
2.06730 |
937.90 |
|
95 |
1.9380 |
0.24415 |
2. 18215 |
989.00 |
|
100 |
2.0400 |
0.25700 |
2.2970 |
1042.00 |
FORMULAS:
O2
= 2.04 x 10⁻² I
H2
= 2.57 x 10⁻³ I
H20
= 10. 42 cc/amp/hr
H2O
= 2. 297 x 10- 2 lb/amp/hr
Each power plant consists of 31 single cells connected
in series and enclosed in a metal pressure jacket. The water separation,
reactant control, and heat transfer components are mounted in a compact
accessory section attached directly above the pressure jacket.
Power plant temperature is controlled by the primary
(hydrogen) and secondary (glycol) loops. The hydrogen pump, providing
continuous circulation of hydrogen in the primary loop, withdraws water
vapor and heat from the stack of cells. The primary bypass valve regulates
flow through the hydrogen regenerator to impart exhaust heat to the
incoming hydrogen gas. Flow is regulated in accordance with skin
temperature. The exhaust gas flows to the condenser where waste heat is
transferred to the glycol; the resultant temperature decrease liquefying
some of the water vapor. The motor-driven centrifugal water separator
extracts the liquid and feeds it to the potable water tank in the CM. The
cool gas is then pumped back to the fuel cell through the primary
regenerator by a motor-driven vane pump, which also compensates for
pressure loss e s due to water extraction and cooling. Waste heat,
transferred to the glycol in the condenser, is transported to the
radiators located on the fairing between the CM and SM, where it is
radiated into space. Individual controls (FUEL CELL RADIATORS, MDC- 3),
can bypass 3/8 of the total radiator area for each power plant. Radiator
area is varied dependent on power plant condenser exhaust and radiator
exit temperatures which are relevant to loads and space environment.
Internal fuel cell coolant temperature is controlled by a condenser
exhaust sensor, which regulates flow through a secondary regenerator to
maintain condenser exhaust within desired limits. When either condenser
exhaust or radiator exit temperature falls below tolerance limits (150°
and - 30°F respectively), the respective FUEL CELL RADIATORS switch is
positioned to EMERG BYPASS to decrease the radiator area in use, thus
decreasing the amount of heat being radiated. Since the three power plants
are relatively close in load sharing and temperature operating regimes,
the effect on the other power plants must be monitored. Generally
simultaneous control over all three poV1rer plants will be required. Use
of the bypass should be minimal because of powerplant design to retain
heat at l ow loads and expel more heat at higher loads. The bypass is
primarily intended for use after failure of two powerplants. Heat
radiation effects on the single powerplant require continuous use of the
bypass for the one remaining powerplant.
Reactant valves provide the interface between the power
plants and cryogenic system. They are opened during pre-launch and closed
only after a power plant malfunction necessitating its permanent isolation
from the d-c system. Prior to launch, the FC REACS VALVES switch (MDC - 3)
is placed to the LATCH position. This applies a holding voltage to the
open solenoids of the Hz and Oz reactant valves of the three power plants.
This voltage is required only during boost to prevent
inadvertent closure due to the effects of high vibration. The reactant
valves cannot be closed by use of the REACTANTS switches {MDC-3) with the
holding voltage applied. The FC REACS VALVES switch is positioned to
NORMAL after earth orbit insertion. During prelaunch, after power plant
activation, the three FC REACS circuit breakers (RHEB-226) are opened to
prevent valve closure through inadvertent REACT ANTS switch activation.
N2 gas is individually stored in each power plant at
1500 psia and regulated to a pressure of 53±3 psia. Output of the
regulator pressurizes the electrolyte in each cell, the coolant loop
through an accumulator, and is coupled to the Oz and Hz regulators as a
reference pressure.
Cryogenic oxygen, supplied to the power plants at
900±35 psia, absorbs heat in the lines, absorbs additional heat in the
preheater, and reaches the oxygen regulator in a gaseous form at
temperatures above 100°F. The differential regulator reduces oxygen
pressure to 9.5 psia above the N2 reference, thus supplying it to the fuel
cell stack at 62.5±2 psia. Within the porous oxygen electrodes, the Oz
reacts with the H2O in the electrolyte and the electrons provided by the
external circuit to produce hydroxyl ions (O2
+ 2H20 + 4e =
40H-).
Cryogenic hydrogen, supplied to the power plants at 245
(+15, -20) psia, is heated in the same manner as the oxygen. The
differential hydrogen regulator reduces the pressure to 8. 5 psia above
the reference N2,
thus supplying it in a gaseous form to the fuel cells at 61. 5±2 psia. The
hydrogen reacts in the porous hydrogen electrodes with the hydroxyl ions
in the electrolyte to produce electrons, water vapor, and heat (2 H2+
40H- = 4H20 + 4e
+ heat). The nickel electrodes act as a catalyst in the reaction. The
water vapor and heat is withdrawn by the circulation of hydrogen gas in
the primary loop and the electrons are supplied to the load.
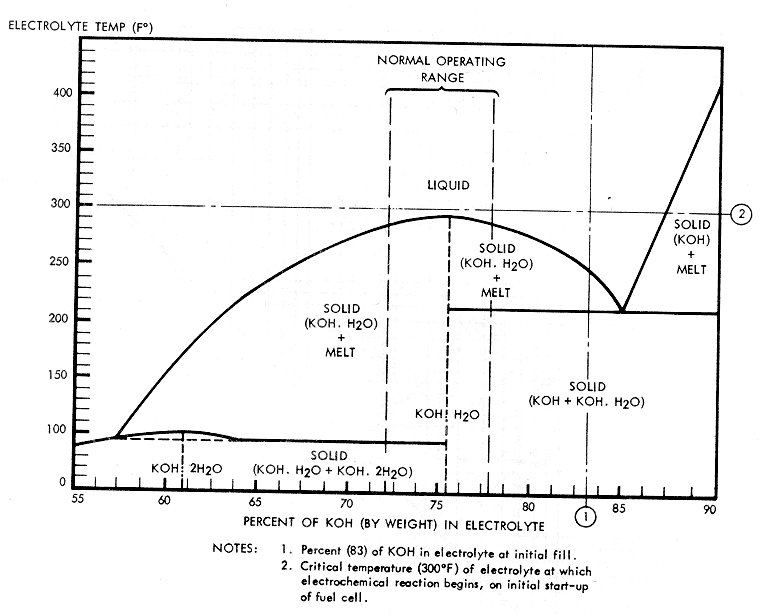
Each of the 31 cells comprising a power plant contains
electrolyte which on initial fill consists of 83 percent potassium
hydroxide (KOH) and 17 percent water by weight. The power plant is
initially conditioned to increase the water ratio, and during normal
operation, water content will vary between 23 and 28 percent. At this
ratio, the electrolyte has a critical temperature of 300°F (KOH H20 Phase Diagram).
It solidifies at an approximate temperature of 220° F. Power plant
electrochemical reaction becomes effective at the critical temperature.
Bringing power plants to critical temperature is performed by GSE and
cannot be performed from SC power sources. Placing a load on the power
plant will maintain it above the critical temperature. The automatic
in-line heater circuit will maintain power plant temperature at 385°F with
no additional loads applied.
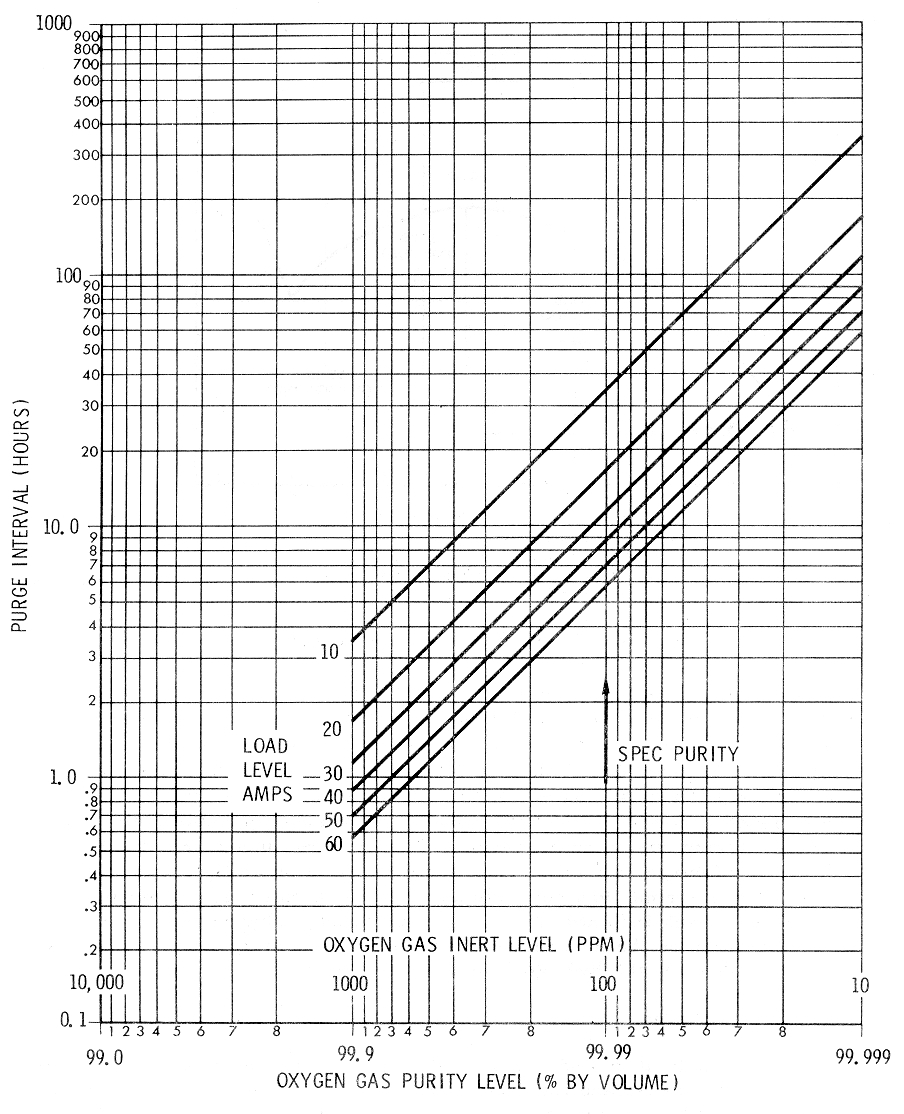
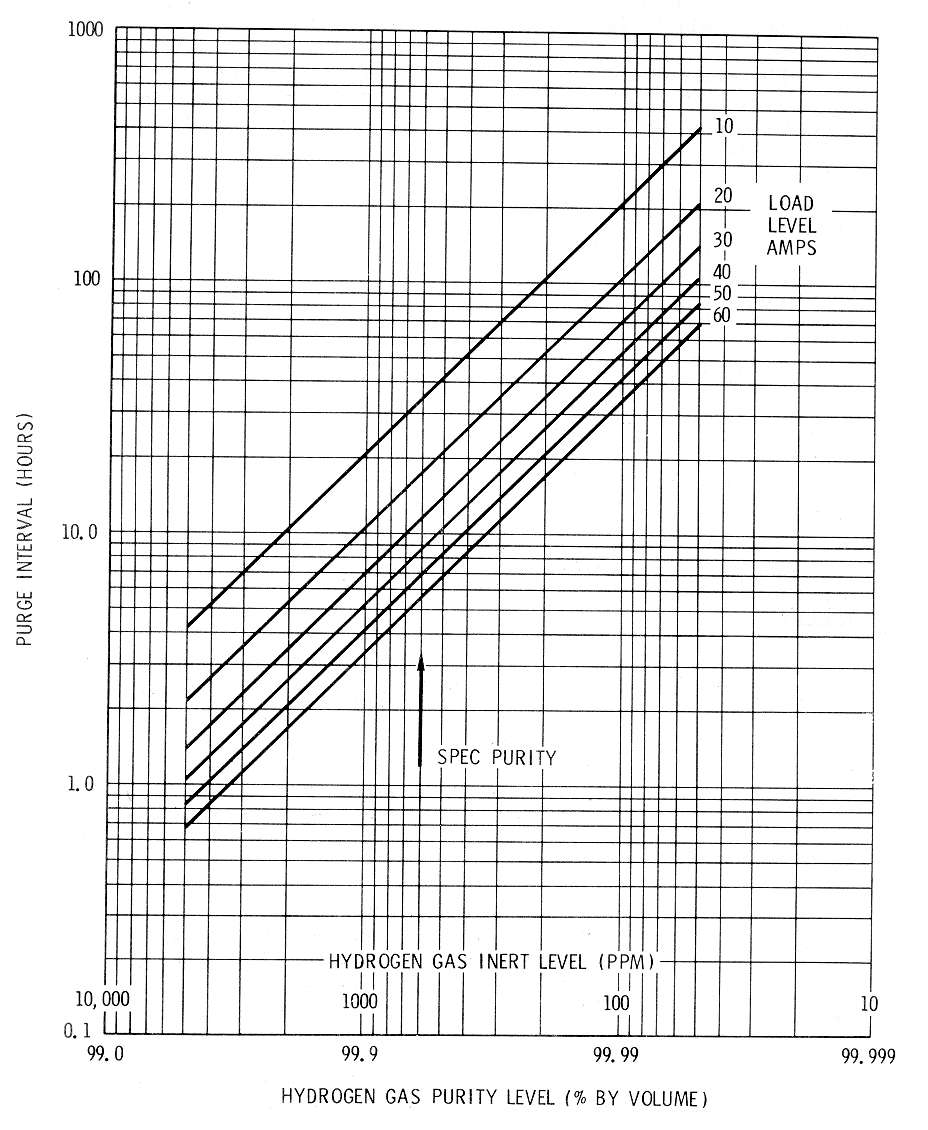
Purging is a function of power demand and gas purity.
Oz purging requires 2 minutes and Hz purging 80 seconds. A hydrogen purge
is preceded by activation of the Hz PURGE LINE HTR switch (MDC-3) 20
minutes prior to the purge. The purge cycle is determined by the mission
power profile and gas purity as sampled after spacecraft tank fill.
OXYGEN GAS PURITY Effect on
Purge Interval Graph and
H2
Gas Purity Effect on Purge Interval Graph
can be used to calculate the
purge cycles, dependent on gas purity and load. A degradation purge can be
performed if power plant current output decreases approximately 3 to 5
amps during sustained operation. The O2
purge has more effect during this type of purge, although it would be
followed by an Hz purge if recovery to normal was not realized after
performing an O2
purge. If the pH talk back indicator (MDC-3) is activated, a hydrogen
purge will not be performed on the fuel cell with the high pH. This
prevents the possibility of clogging the hydrogen vent line.
OXYGEN GAS PURITY
Effect on Purge Interval Graph
H2 Gas Purity Effect on
Purge Interval Graph
The application and removal of fuel cell loads causes
the terminal voltage to decrease and increase, respectively. A decrease in
terminal voltage, resulting from an increased load, is followed by a
gradual increase in fuel cell skin temperature which causes an increase in
terminal voltage. Conversely, an increase in terminal voltage, resulting
from a decreased load, is followed by a gradual decrease in fuel cell skin
temperature which causes a decrease in terminal voltage.
The range in which the terminal voltage is permitted to
vary is determined by the high and low voltage input design limits of the
components being powered. For most components the limits are 30 volts de
and 25 volts dc. To remain within these design limits, the d-c bus voltage
must be maintained between 31.0 and 26.2 volts dc. To compensate for
cyclic loads, it is recommended sustained bus voltage be maintained
between 26.5 and 30.0 vdc. Bus voltage is maintained within prescribed
limits by the application of entry and postlanding batteries during load
increases (power up). Load increase or decrease falls well within the
limits of power supply capability and, under normal conditions, should not
require other than normal checklist procedures.
Powering up spacecraft systems is performed in one
continuous sequence providing the main bus voltage does not decrease below
26.5 volts. If bus voltage decreases to this level, the power up sequence
can be interrupted for the time required for fuel cell temperatures to
increase with the resultant voltage increase or the batteries can be
connected to the main buses thus reducing the fuel cell load. In most
cases, powering up can be performed in one continuous sequence; however,
when starting from an extremely low spacecraft load, it is probable that a
power up interruption or earlier battery coupling may be required. The
greatest load increase occurs while powering up for a delta V maneuver.
Powering down spacecraft systems is performed in one
continuous sequence providing the main bus voltage does not increase above
31.0 volts. Powering down from relatively high spacecraft load levels,
i.e. , following a delta V, the sequence may have to be interrupted for
the time required for fuel cell temperature, and as a result, bus voltage
to decrease. To expedite power down, one fuel cell can be disconnected
from the buses increasing the loads on the remaining fuel cells and
decreasing bus voltage, thus allowing continuation of the power down
sequence.
If the requirement arises to maintain a powerplant on
open circuit, temperature decay would occur at an average rate of
approximately 6° /hr., with the automatic in-line heater circuit
activating at a skin temperature of 385° F and maintaining powerplant
temperature at 385°F. In-line heater activation can be confirmed by a 4.5
to 6 amp indication as observed on the d-camps meter (MDC-3) with the d-c
indicator switch positioned to the open circuited fuel cell position.
Reactant valves remain open. Fuel cell pumps can be turned off until the
in-line heater circuit activates, at which time they must be on.
Closing of reactant valves during a power plant
disconnect is dependent on the failure experienced. If power plant failure
is such as to allow future use, i.e., shutdown due to partially degraded
output, it is recommended the reactant valves remain open to provide a
positive reactant pressure. The valves should be closed after power-plant
skin temperature decays below 300°F. The reactant valves are closed during
initial shutdown, if the failure is a reactant leak, an abnormally high
regulator output pressure, or complete power-plant failure.
Prior to disconnecting a fuel cell, if a single
inverter is being used, each of the remaining power plants is connected to
both main d-c buses to enhance load sharing since bus loads are
unbalanced. If two inverters are being used, main d-c bus loads are
relatively equal; therefore, each of the remaining power plants is
connected to a separate main d-c bus for bus isolation. If one power plant
had been placed on open circuit for an extended period of time, prior to
powering up to a configuration requiring three power plants, reconnecting
is accomplished prior to the time of heavy load demands. This permits
proper conditioning of the power plant which has been on open circuit. The
time required for proper conditioning is a function of skin temperature
increase and the load applied to the power plant.
Each inverter (Inverter
Block Diagram) is composed of an oscillator, an eight-stage
digital countdown section, a d-c line filter, two silicon-controlled
rectifiers, a magnetic amplifier, a buck-boost amplifier, a demodulator,
two d-c filters, an eight-stage power inversion section, a harmonic
neutralization transformer, an a-c output filter, current sensing
transformers, a Zener diode reference bridge, a low-voltage control, and
an overcurrent trip circuit. The inverter normally uses a 6.4-kHz square
wave synchronizing signal from the central timing equipment (GTE) which
maintains inverter output at 400 Hz. If this external signal is completely
lost, the free running oscillator within the inverter will provide pulses
that will maintain inverter output within ±7 Hz. The internal oscillator
is normally synchronized by the external pulse. The subsequent paragraphs
describe the function of the various stages of the inverter.
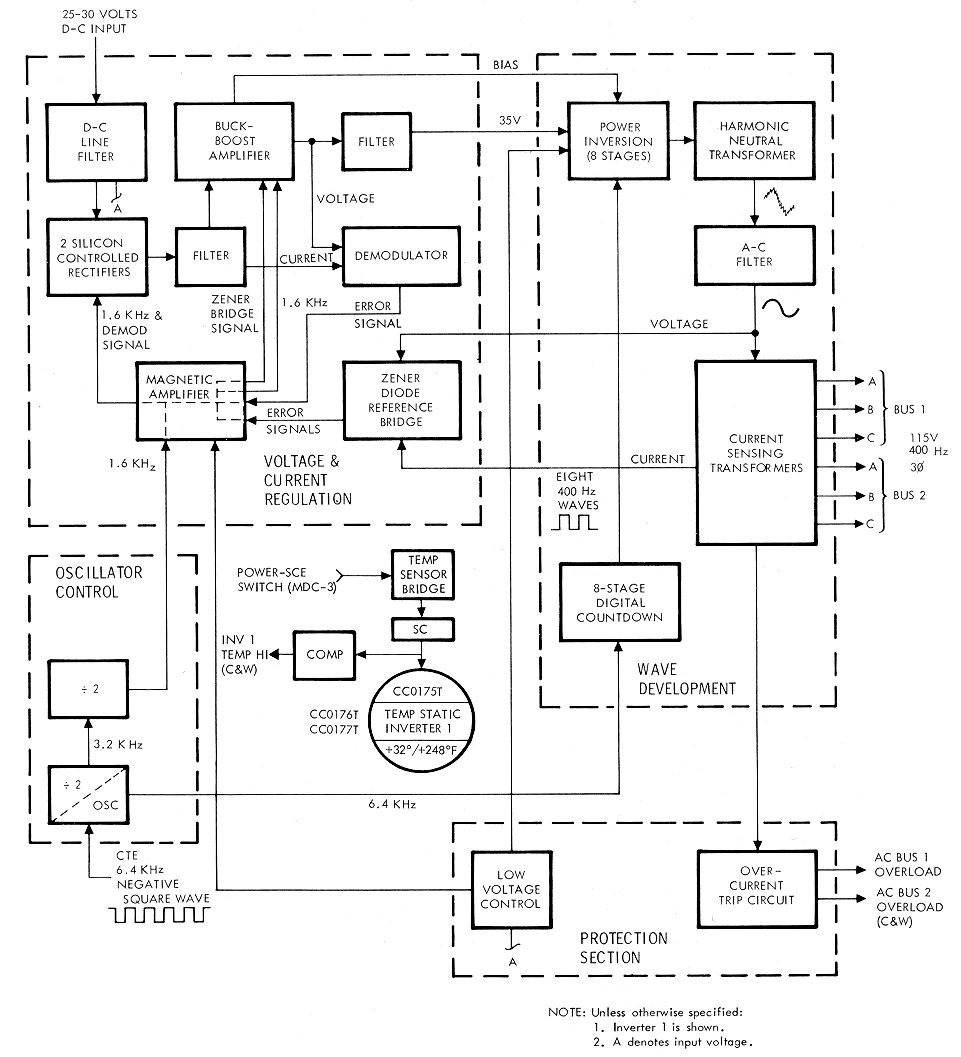
The 6. 4-kHz square wave provided by the GTE is applied
through the internal oscillator to the eight-stage digital countdown
section. The oscillator has two divider circuits which provide a 1600-Hz
signal to the magnetic amplifier.
The eight-stage digital countdown section, triggered by
the 6 .4- kHz signal, produces eight 400-Hz square waves, each mutually
displaced one pulse-time from the preceding and following wave. One
pulse-time is 156 microseconds and represents 22. 5 electrical degrees.
The eight square waves are applied to the eight-stage power inversion
section.
The eight-stage power inversion section, fed a
controlled voltage from the buck-boost amplifier, amplifies the eight 400-
Hz square waves produced by the eight-stage digital countdown section. The
amplified square waves, still mutually displaced 22.5 electrical degrees,
are next applied to the harmonic neutralization transformer.
The harmonic neutralization section consists of 31
transformer windings on one core. This section accepts the 400-Hz
square-wave output of the eight-stage power inversion section and
transforms it into a 3-phase 400-Hz 115-volt signal. The manner in which
these transformers are wound on a single core produces flux cancellation
which eliminates all harmonics up to and including the fifteenth of the
fundamental frequency. The 22.5-degree displacement of the square waves
provides a means of electrically rotating the square wave excited primary
windings around the 3-phase, wye-connected secondary windings, thus
producing the 3-phase 400Hz sine wave output. This 11 5-vol t signal is
then applied to the ac output filter.
The a-c output filter eliminates the remaining higher
harmonics. Since the lower harmonics were eliminated by the harmonic
neutral transformer, the size and weight of this output filter was
reduced. Circuitry in this filter also produces a rectified signal which
is applied to the Zener diode reference bridge for voltage regulation. The
amplitude of this signal is a function of the amplitude of a-c output
voltage. After filtering, the 3-phase 115-volt a-c 400-Hz, sine wave is
applied to the a-c buses through individual phase current sensing
transformers.
The current-sensing transformers produce a rectified
signal, the amplitude of which is a direct function of inverter output
current magnitude. This d-c signal is applied to the Zener diode reference
bridge to regulate inverter current output; it is also paralleled to an
over current sensing circuit.
The Zener diode reference bridge receives a rectified
dc signal, representing voltage output, from the circuitry in the a-c
output filter. A variance in voltage output unbalances the bridge,
providing an error signal of proper polarity and magnitude to the
back-boost amplifier via the magnetic amplifier. The buck-boost amplifier,
through its bias voltage output, compensates for voltage variations. When
inverter current, output reaches 200 to 250 percent of rated current, the
rectified signal applied to the bridge from the current sensing
transformers is of sufficient magnitude to provide an error signal causing
the buck-boost amplifier to operate in the same manner as during an
overvoltage condition. The bias output of the buck-boost amplifier,
controlled by the error signal, will be varied to correct for any
variation in inverter voltage or a beyond tolerance increase in current
output. When inverter current output exceeds 250 percent of rated current,
the overcurrent sensing circuit is activated.
The overcurrent sensing circuit monitors a rectified
d-c signal representing current output. When total inverter current output
exceeds 250 percent of rated current, this circuit will illuminate an
overload lamp in 15±5 seconds. If current output of any single phase
exceeds 300 percent of rated current, this circuit will illuminate the
overload lamp in 5±1 seconds. The AC BUS 1 OVERLOAD and AC BUS 2 OVERLOAD
lamps are in the caution/warning matrix on MDC-2.
D-C power to the inverter is supplied from the main d-c
buses through the d-c line filter. The filter reduces the high frequency
ripple in the input, and the 25 to 30 volts de is applied to two
silicon-controlled rectifiers.
The silicon-controlled rectifiers are alternately set
by the 1600-Hz signal from the magnetic amplifier to produce a d-c square
wave with an on-time of greater than 90 degrees from each rectifier. This
is filtered and supplied to the buck-boost amplifier where it is
transformer-coupled with the amplified 1600-Hz output of the magnetic
amplifier, to develop a filtered 35 volts de which is used for
amplification in the power inversion stages.
The buck-boost amplifier also provides a variable bias
voltage to the eight-stage power inversion section. The amplitude of this
bias voltage is controlled by the amplitude and polarity of the feedback
signal from the Zener diode reference bridge which is referenced to output
voltage and current. This bias signal is varied by the error signal to
regulate inverter voltage and maintain current output within tolerance.
The demodulator circuit compensates for any
low-frequency ripple (10 to 1000 Hz) in the d-c input to the inverter. The
high-frequency ripple is attenuated by the input filters. The demodulator
senses the 35-volt d-c output of the buck-boost amplifier and the current
input to the buck-boost amplifier. An input d-c voltage drop or increase
will be reflected in a drop or increase in the 35-volt d-c output of the
buck-boost amplifier, as well as a drop or increase in current input to
the buck-boost amplifier. A sensed decrease in the buck-boost amplifier
voltage output is compensated for by a demodulator output, coupled through
the magnetic amplifier to the silicon-controlled rectifiers. The
demodulator output causes the SCRs to conduct for a longer time, thus
increasing their filtered d-c output. A sensed increase in buck-boost
amplifier voltage output, caused by an increase in d-c input to the
inverter, is compensated for by a demodulator output coupled through the
magnetic amplifier to the silicon-controlled rectifiers causing them to
conduct for shorter periods; thus producing a lower filtered d-c output to
the buck-boost amplifier. In this manner, the 35-volt d-c input to the
power inversion section is maintained at a relatively constant level
irrespective of the fluctuations in d-c input voltage to the inverter.
The low-voltage control circuit samples the input
voltage to the inverter and can terminate inverter operation. Since the
buck-boost amplifier provides a boost action during a decrease in input
voltage to the inverter, in an attempt to maintain a constant 35 volts dc
to the power inversion section and a regulated 115-volt inverter output,
the high boost required during a low-voltage input would tend to overheat
the solid state buck-boost amplifier. As a precautionary measure, the
low-voltage control will terminate inverter operation by disconnecting
operating voltage to the magnetic amplifier and the first power inversion
stage when input voltage decreases to between 16 and 19 volts dc.
A temperature sensor with a range of +32° to +248°F is
installed in each inverter and provides an input to the C&WS which
will illuminate a light at an inverter overtemperature of 190° F. Inverter
temperature is telemetered to MSFN.
A Constant voltage solid-state battery charger (Battery Charger Block Diagram),
located in the CM lower equipment bay, is incorporated into the EPS. The
BATTERY CHARGER selector switch (MDC-3) controls power input to the
charger, as well as connecting the charger output to the selected battery
(Battery
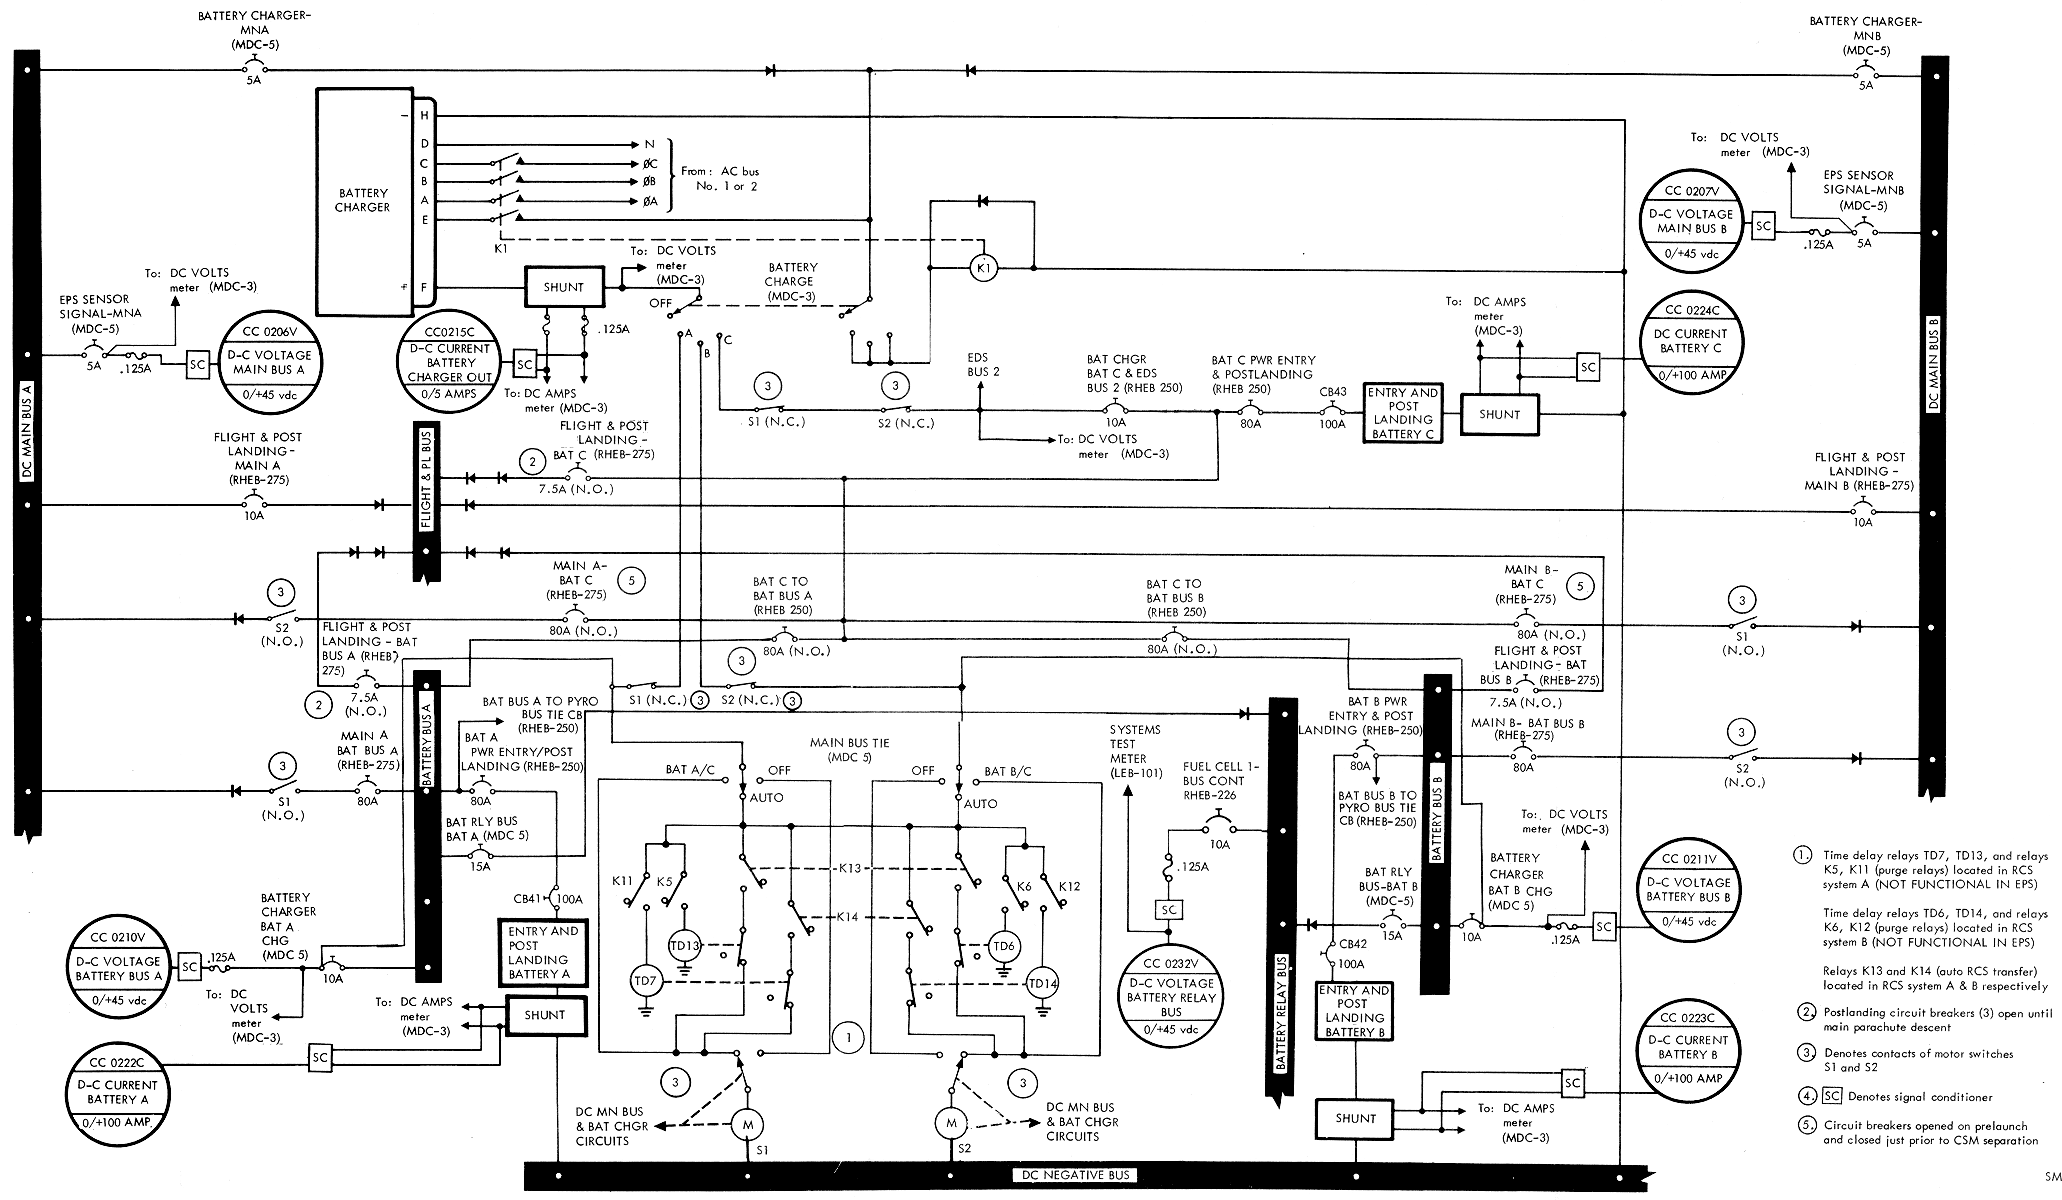
Charger and CM D-C Bus Control Circuits Schematic). When the
BATTERY CHARGER selector switch is positioned to entry battery A, B, or C,
a relay (Kl) is activated completing circuits from a-c and d-c power
sources to the battery charger. Battery charger output is also connected
to the selected battery to be charged through contacts of the MAIN BUS TIE
motor switch. Positioning the MAIN BUS TIE switch (A/C or B/C) to OFF for
battery A or B, and both switches to OFF for battery C will disconnect
main bus loads from the respective batteries and also complete the circuit
from the charger to the battery.
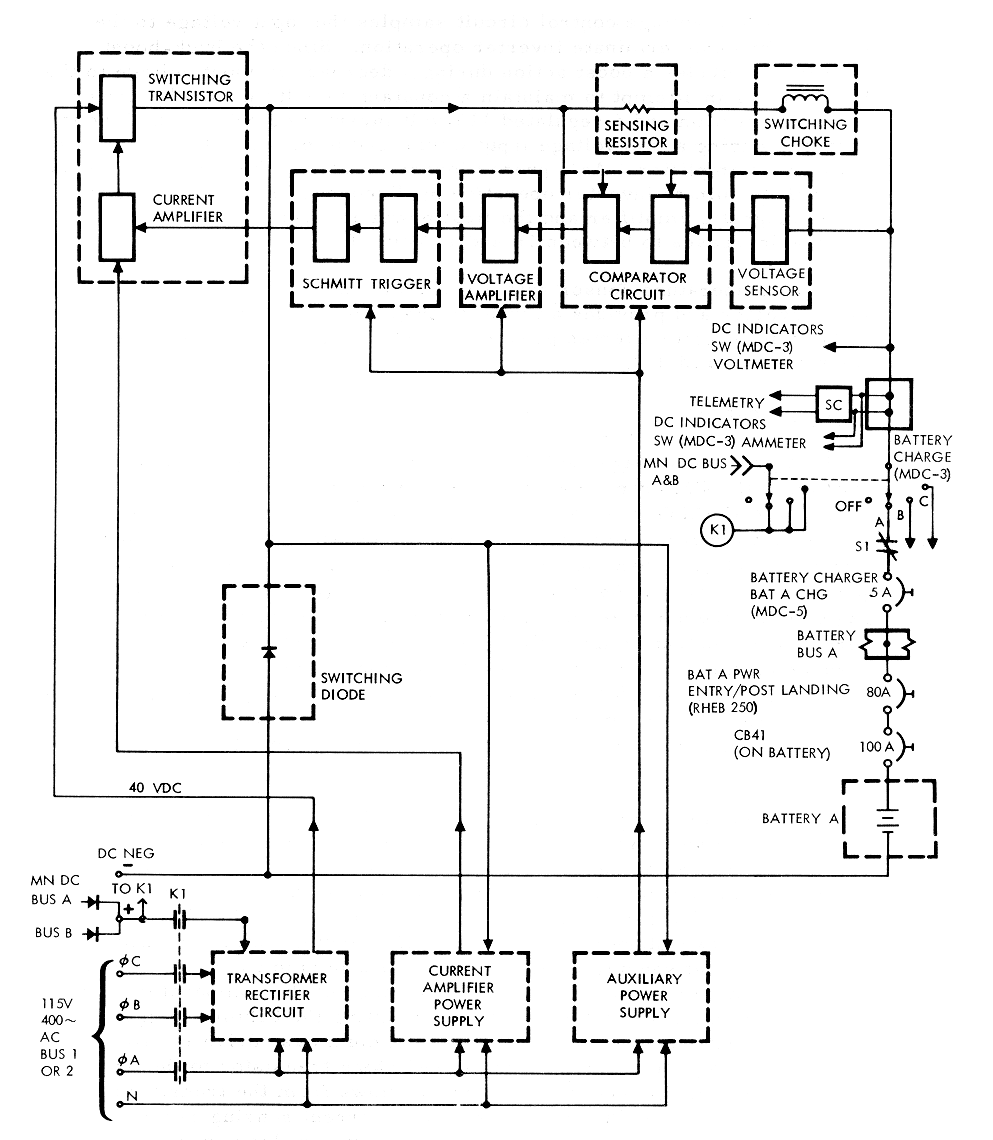
Battery
Charger and CM D-C Bus Control Circuits Schematic
The battery charger is provided 25 to 30 volts from
both main d-c buses and 115 volts 400-Hz 3-phase from either of the a-c
buses. All three phases of ac are used to boost the 25 to 30-volt d-c
input and produce 40 volts de for charging. In addition, phase A of the ac
is used to supply power for the charger circuitry. The logic network in
the charger, which consists of a two-stage differential amplifier
(comparator), Schmitt trigger, current sensing resistor, and a voltage
amplifier, sets up the initial condition for operation. The first stage of
the comparator is in the on mode, with the second stage off, thus setting
the Schmitt trigger first stage to on with the second stage off. Maximum
base drive is provided to the current amplifier which turns the switching
transistor to the on mode. With the switching transistor on, current flows
from the transformer rectifier through the switching transistor, current
sensing resistor, and switch choke to the battery being charged. Current
lags voltage due to switching choke action. As current flow increases, the
voltage drop .across the sensing resistor increases, and at a specific
level sets the first stage of the comparator to off and the second stage
to on. The voltage amplifier is set off to reverse the Schmitt trigger to
first stage off and second stage on. This sets the current amplifier off,
which in turn sets the switching transistor off. The switching transistor
in the off mode terminates power from the source, causing the field in the
choke to continue collapsing, discharging into the battery, then through
the switching diode and the current sensing resistor to the opposite side
of the choke. As the EMF in the choke decreases, current through the
sensing resistor decreases, reducing the voltage drop across the resistor.
At some point, the decrease in voltage drop across the sensing resistor
reverses the comparator circuit, setting up the initial condition and
completing one cycle of operation. The output load current, due to the
choke action, remains relatively constant except for the small variation
through the sensing resistor. This variation is required to set and reset
the switching transistor and Schmitt trigger through the action of the
comparator.
Battery charger output is regulated by the sensing
resistor until battery voltage reaches approximately 37 volts. At this
point, the biased voltage sensor circuit is unbiased, and in conjunction
with the sensing resistor provides a signal for cycling the battery
charger. As battery voltage increases, the internal impedance of the
battery increases, decreasing current flow from the charger. At 39.8
volts, the battery is fully charged and current flow becomes negligible. (Battery
Charger Output (Amperes) Graph.) Recharging the batteries
until battery amp hour input equates amp hours previously discharged from
the battery assures sufficient battery capacity for mission completion.
The MSFN will monitor this function. If there is no contact with the MSFN,
battery charging is terminated when the voltmeter indicates 39. 5 vdc with
the DC INDICATORS switch set to the BAT CHARGER position.
Battery Charger
Output (Amperes) Graph
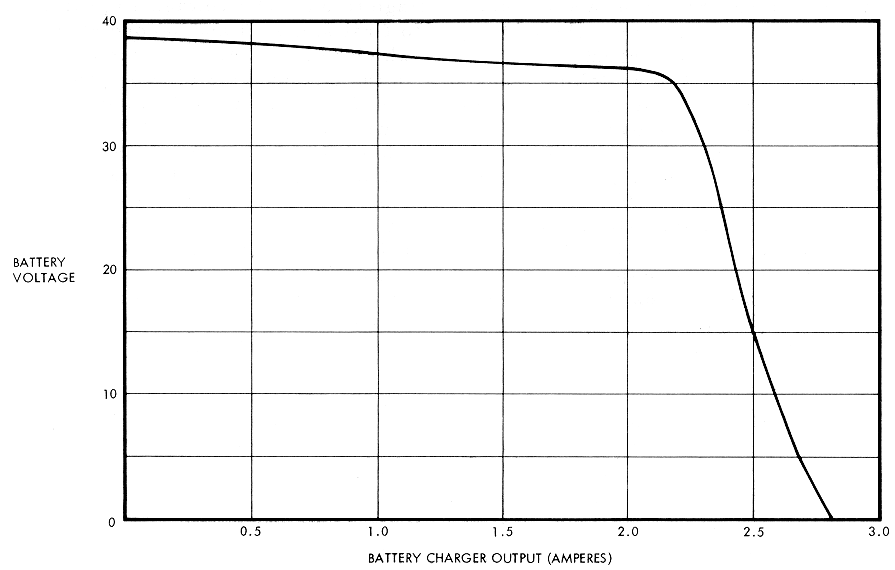
Charger voltage is monitored on the DC VOLTS METER (MDC
-3). Current output is monitored on the inner scale of the DC AMPS meter
(MDC-3) by placing the DC INDICATORS switch (MDC-3) to the BAT CHARGER
position. Battery charger current output is telemetered to the MSFN.
When charging battery A or B, the respective BAT RLY
BUSBAT A or B circuit breaker (MDC-5) is opened to expedite recharge.
During this period, only one battery will be powering the battery relay
bus. Relay bus voltage can be monitored by selecting positions 4 and B on
the Systems Test Meter (LEB-101) and from the couches by the Fuel
Cell-Main Bus B-1 and Fuel Cell - Main Bus A-3 talk back indicators
(MDC-3) which will be barber-poled. If power is lost to the relay bus,
these indicators will revert to the gray condition indicating loss of
power to the relay bus and requiring remedial action.
Recharge of a battery immediately after it is exposed
to any appreciable loads requires less time than recharge of a battery
commencing 30 minutes or more after it is disconnected from these loads.
Therefore, it is advantageous to connect batteries to the charger as soon
as possible after they are disconnected from the main buses since this
decreases overall recharge time.
D-C and a-c power distribution to components of the EPS
is provided by two redundant buses in each system. A single -point ground
on the spacecraft structure is used to eliminate ground loop effects.
Sensing and control circuits are provided for monitoring and protection of
each system.
Distribution of d-c power (D-C Power Distribution Diagram)
is accomplished with a two-wire system and a series of interconnected
buses, switches, circuit breakers, and isolation diodes. The d-c negative
buses are connected to the vehicle ground point (VGP). The buses consist
of the following:
•
Two main d -c buses (A and B),
powered by the three fuel cells and/ or entry and postlanding batteries A,
B, and C.
•
T wo battery buses (A and B ),
each powered by its respective entry and postlanding battery A and B.
Battery C can power either or both buses if batteries A and/ or B fail.
•
Flight and postlanding bus,
powered through both main d-c buses and diodes, or directly by the three
entry and postlanding batteries, A, B, and C, through dual diodes.
•
Flight bus, powered through both
main d-c buses and isolation diodes.
•
Nonessential bus, powered through
either d-c main bus A or B.
•
Battery relay bus, powered by
entry and postlanding batteries through the individual battery buses and
isolation diodes.
•
Pyro buses, isolated from the
main electrical power system when powered by the pyro batteries. A
capability is provided to connect either entry battery to the A or B pyro
system in case of loss of a pyro battery.
•
SM jettison controllers, powered
by the fuel cell power plants and completely isolated from the main
electrical power system until activated during CSM separation.
D-C Power
Distribution Diagram
Power from the fuel cell power plants can be connected
to the main d-c buses through six motor switches (part of overload/reverse
current circuits in the SM) which are controlled by switches in the CM
located on MDC- 3. Fuel cell power can be selected to either or both of
the main d- c buses. Six talk back indicators show gray when fuel cell
output is connected and striped when disconnected. When an overload
condition occurs, the overload-reverse current circuits in the SM
automatically disconnect the fuel cell power plants from the overloaded
bus and provide visual displays (talk-back indicator and caution and
warning lamp illumination) (FC BUS DISCONNECT) for isolation of the
trouble. A reverse current condition will disconnect the malfunctioning
power plant from the d-c system. D-C undervoltage sensing circuits (D-C and A-C Voltage Sensing
Schematic) are provided to indicate bus low-voltage
conditions. If voltage drops below 26. 25 volts d-c, the applicable d-c
undervoltage light on the caution and warning panel (MDC-2) will
illuminate. Since each bus is capable of handling all EPS loads, an
undervoltage condition should not occur except in an isolated instance; if
too many electrical units are placed on the bus simultaneously or if a
malfunction exists in the EPS. A voltmeter (MDC-3) is provided to monitor
voltage of each main d-c bus, the battery charger, and each of the five
batteries. An ammeter is provided (MDC-3) to monitor current output of
fuel cells 1, 2, 3, batteries A, B, C, and the battery charger.
D-C and A-C Voltage
Sensing Schematic
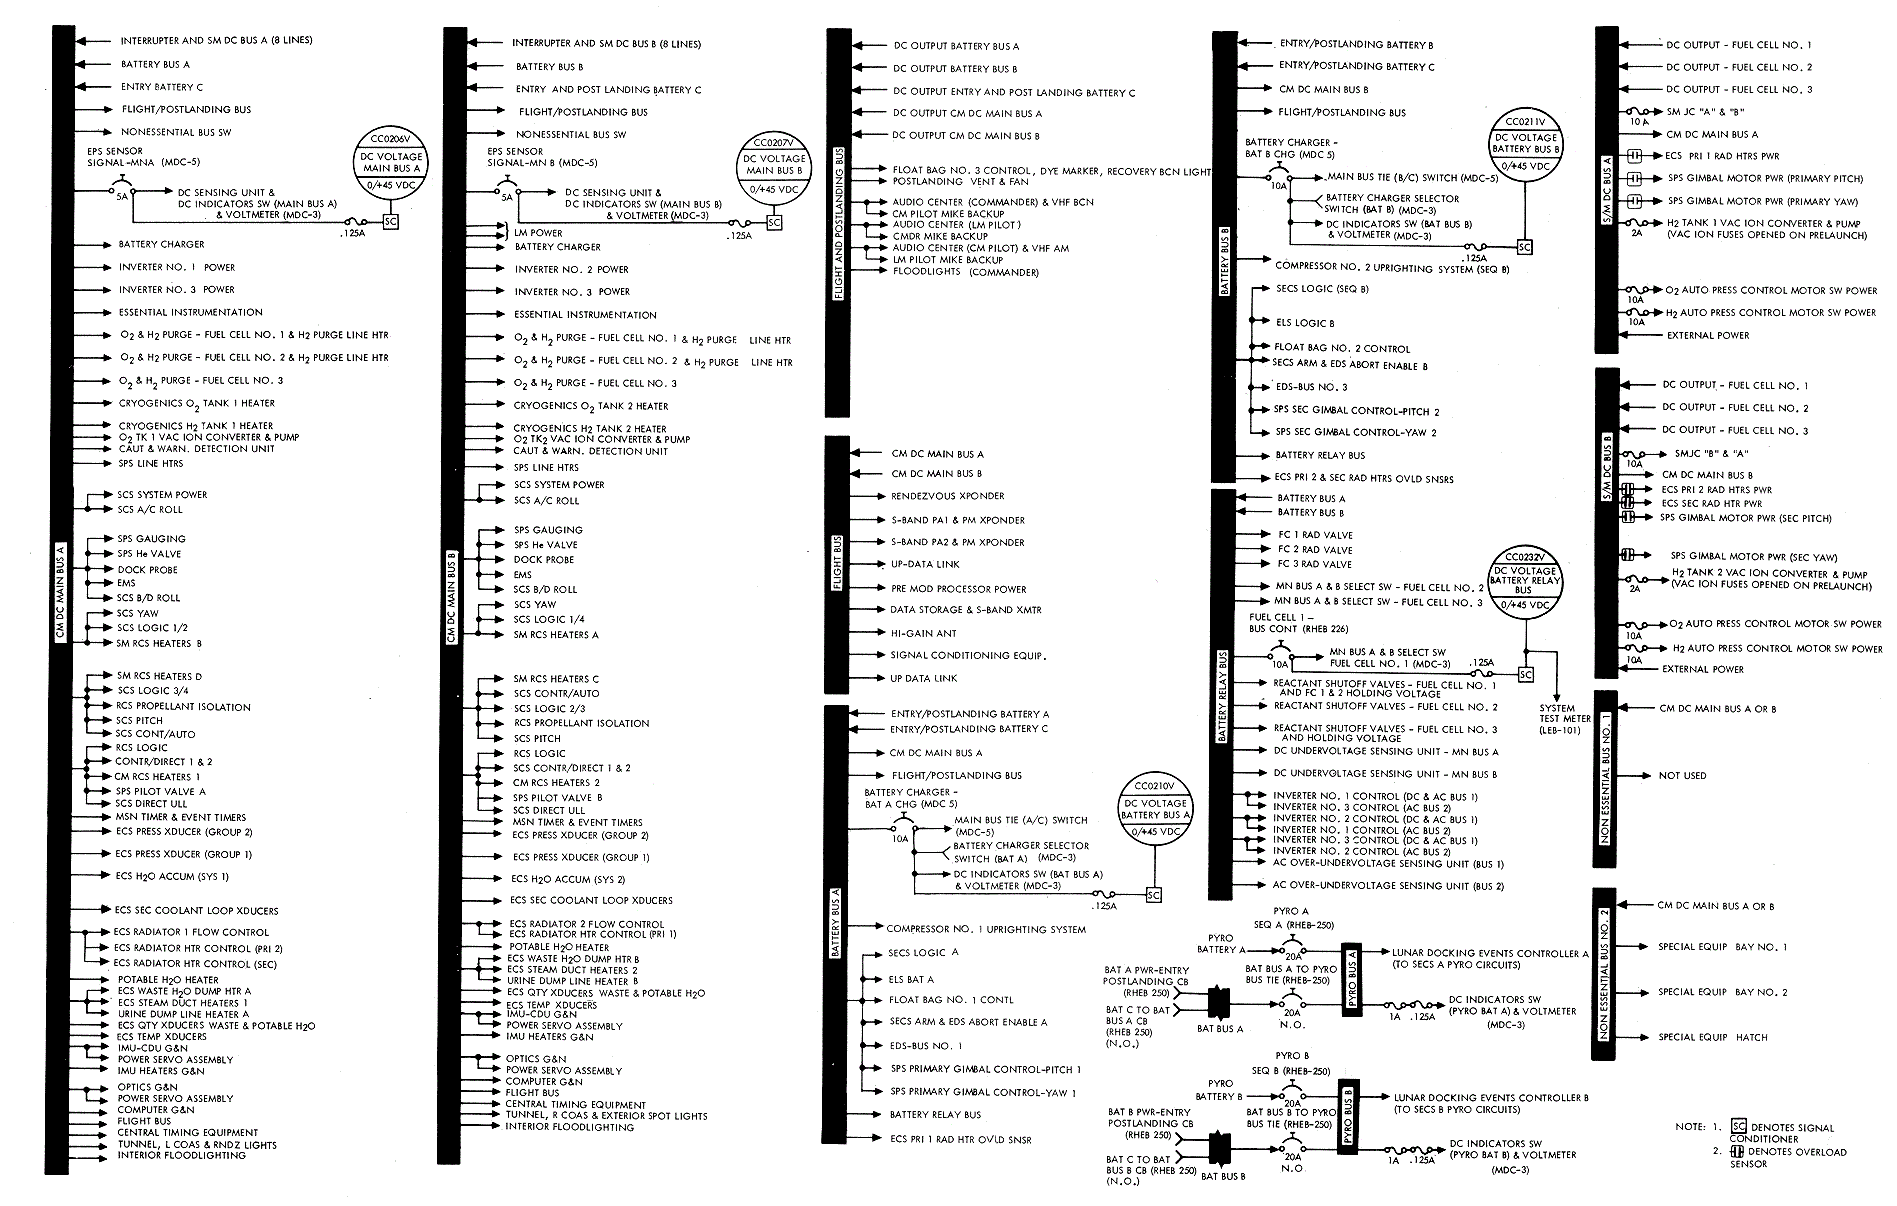
During high power demand or emergencies, supplemental
power to the main d-c buses can be supplied from batteries A and B via the
battery buses and directly from battery C (Battery Charger and CM D-C Bus
Control Circuits Schematic). During entry, spacecraft power is
provided by the three entry and postlanding batteries which are connected
to the main d-c buses prior to CSM separation; placing the MAIN BUS TIE
switches (MDC-5) to BAT A / C and BAT B/C provides this function after
closing the MAIN A-BAT C and MAIN B-BAT C circuit breakers (RHEB-275). The
switches are manually placed to OFF after completion of RCS purge and
closing the FLIGHT AND POST LDGBAT B US A, BAT BUS B, and BAT C circuit
breakers (RHEB-275) during main chute descent. The AUTO position provides
an automatic connection of the entry batteries to the main d-c buses at
CSM separation. The auto function is used only on the launch pad after the
spacecraft is configured for a LES pad abort.
A nonessential bus, as shown on
D-C Power Distribution Diagram permits isolating
nonessential equipment during a shortage of power (two fuel cell power
plants out). The flight bus distributes power to in-flight
telecommunications equipment. The flight and postlanding bus distributes
power to some of the in-flight telecommunications equipment, float bag No.
3 controls, the ECS postlanding vent and blower control, and postlanding
communications and lighting equipment. In flight, the postlanding bus
receives power from the fuel cells and/or entry and postlanding batteries
through the main d-c buses. After completion of RCS purge during main
chute descent, the entry batteries supply power to the postlanding bus
directly through individual circuit breakers. These circuit breakers
(FLIGHT & POST LANDING-BAT BUS A, BAT BUS B, and BAT C - RHEB-275) are
normally open in flight and closed during main chute descent just prior to
positioning the MAIN BUS TIE switches to OFF.
Motor switch contacts which close when the MAIN BUS TIE
switches are placed to ON, complete the circuit between the entry and
postlanding batteries and the main d-c buses, and open the connection from
the battery charger to the batteries. The battery relay bus provides d-c
power to the a-c sensing units, the fuel cell and inverter control
circuits, fuel cell reactant and radiator valves and the fuel cell-main
BUS A and B talk-back indicators on MDC-3. The pyrotechnic batteries
supply power to ordnance devices for separation of the LES, S-IVB, forward
heat shield, SM from CM, and for deployment and release of the drogue and
main parachutes during a pad abort, high-altitude abort, or normal mission
progression. The three fuel cell power plants supply power to the SM
jettison controllers for the SM separation maneuver.
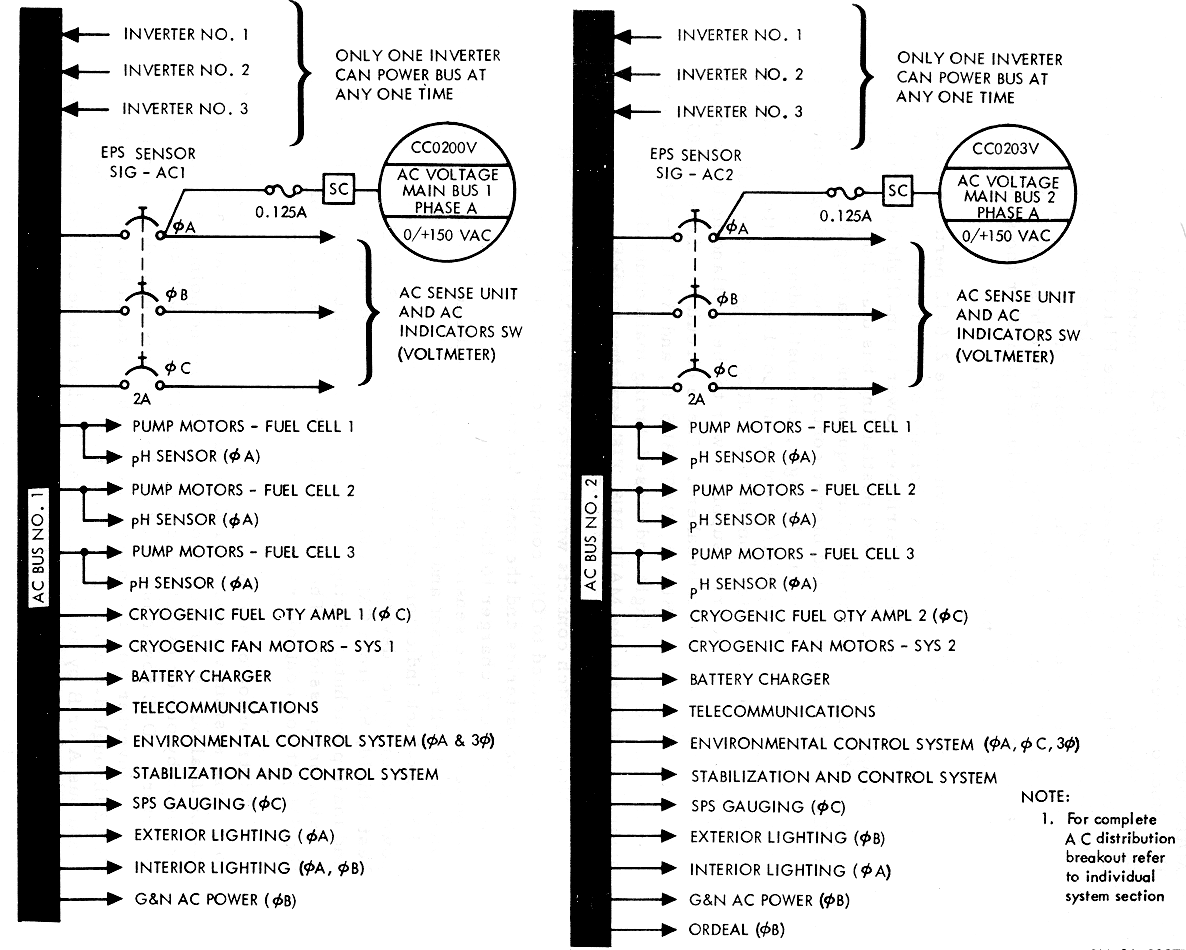
Distribution of a-c power (A-C Power Distribution Diagram)
is accomplished with a four-wire system via two redundant buses, a-c bus l
and a-c bus 2. The a-c neutral bus is connected to the vehicle ground
point. A-C power is provided by one or two of the solid-state 115/200-volt
400-Hz 3-phase inverters. D-C power is routed to the inverters through the
main d-c buses. Inverter No. 1 is powered through d-c main bus A, inverter
No. 2 through d-c main bus B, and inverter No. 3 through either d-c main
bus A or B by switch selection. Each of these circuits has a separate
circuit breaker .and a power control motor switch. Switches for applying
power to the motor switches are located on MDC- 3. All three inverters are
identical and are provided with overtemperature circuitry. A light
indicator, in the caution/warning group on MDC-2, illuminates at 190° to
indicate an overtemperature situation. Inverter output is r outed through
a series of control motor switches to the a-c buses. Six switches (MDC-3)
control motor switches which operate contacts to connect or disconnect the
inverters from the a-c buses. Inverter priority is 1 over 2, 2 over 3, and
3 over 1 on any one a-c bus. This indicates that inverter two cannot be
connected to the bus until the inverter 1 switch is positioned to OFF.
Also, when inverter 3 switch is positioned to ON, it will take inverter 1
off the bus before inverter 3 connection will be per formed. The motor
switch circuits are designed to prevent connecting two inverters to the
same a-c bus at the same time. A-C loads receive power from either a-c bus
through bus selector switches. In some instances, a single phase is used
for operation of equipment and in others all three. Overundervoltage and
overload sensing circuits (D-C and A-C Voltage Sensing
Schematic) are provided for each bus. An automatic inverter
disconnect is effected during an overvoltage. A-C bus voltage fail and
overload lights in the caution/ warning group (MDC-2) provide a visual
indication of voltage or overload malfunctions. Monitoring voltage of each
phase on each bus is accomplished by selection with the AC INDICATORS
switch (MDC-3). Readings are displayed on the AC VOLTS meter (MDC-3).
Phase A voltage of each bus is telemetered to MSFN stations.
A-C Power
Distribution Diagram
Several precautions should be taken during any inverter
switching. The first precaution is to completely disconnect the inverter
being taken out of the circuit whether due to inverter transfer or
malfunction. The second precaution is to insure that no more than one
switch on AC BUS 1 or AC BUS 2 (MDC-3) is in the up position at the same
time. These precautions are necessary to assure positive power transfer
since power to any one inverter control motor switch is routed in series
through the switch of another inverter. A third precaution must be
exercised to preclude a motor switch lockout when d-c power to inverter 3
is being transferred from d-c main bus A to d-c main bus B, or vice versa.
The AC INVERTER 3 switch (MDC-3) should be held in the OFF position for
one second when performing a power transfer operation from one main d-c
bus to the other.
AC and de performance and design data for the EPS is as
follows:
AC
|
Phases |
3
|
|
Displacement |
120±2 degrees
|
|
Steady-state voltage |
115.5 (+l, -1.5) vac (average 3 phases)
|
|
Transient voltage |
115 (+35, -65) vac |
|
Recovery |
To 115±10v within 15 ms, steady state witl1in 50 ms |
|
Unbalance |
2 vac (worst phase from average) |
|
Frequency limits Normal (synchronized to central timing equipment) |
400±3 Hz |
|
Emergency (loss of central timing equipment) |
400±7 Hz |
|
Wave characteristics (sine wave) |
|
|
Maximum distortion |
5 percent |
|
Highest harmonic |
4 percent |
|
Crest factor |
1.414±10 percent |
|
|
|
DC
|
Steady-state voltage limits Normal |
29±2.0 vdc |
|
Minimum CM bus |
26.2 vdc |
|
Min Precautionary CM bus |
2 6. 5 vdc (allows for cyclic loads) |
|
Maximum CM bus |
31. 0 vdc |
|
Max Precautionary CM bus |
30. 0 vdc (allows for cyclic loads) |
|
During postlanding and preflight checkout periods |
27 to 30 vdc |
|
Ripple voltage |
1v peak to peak |
|
|
|
OPERATIONAL LIMITATIONS AND RESTRICTIONS
Fuel cell power plants are designed to function under
atmospheric and high-vacuum conditions. Each must be able to maintain
itself at sustaining temperatures and minimum electrical loads at both
environment extremes. To function properly, fuel cells must operate under
the following limitations and restrictions:
|
External
nonoperating
temperature |
-20°
to +140°
F
|
|
Operating temperature
inside
SM |
+30
°
to 145°F
|
|
External
nonoperating
pressure |
Atmospheric
|
|
Normal
voltage |
27
to 31
vdc
|
|
Minimum operating
voltage
at
terminals
Emergency
operation |
20. 5 vdc
at
2295 watts (gross
power level) |
|
Minimum operating
voltage
at
terminals
Normal operation |
27
vdc |
|
Maximum operating voltage at terminals |
31. 5 vdc
|
|
Fuel cell disconnect
overload |
75
amperes
no
trip,
112
amperes
disconnect after 25
to
300
seconds |
|
Maximum reverse current |
1 second minimum
before
disconnect |
|
Minimum sustaining
power/fuel
cell power-plant
(with
in-line
heater.
OFF) |
420 watts |
|
In-line
heater power
(sustain
F/C skin temp above 385°F min) |
160
watts
(5
to
6
amps) |
|
Maximum
gross
power under emergency
conditions |
2295
watts
at 20.5
vdc
min. |
|
Nitrogen
pressure |
50.2
to 57.5
ps1a
(53 psia, nominal) |
|
Reactant pressure Oxygen |
58.4
to 68.45
ps1a
(62.5 psia, nominal)
|
|
Hydrogen |
57. 3 to 67. 0 psia (61. 5 psia, n.ominal) |
|
Reactant consumption/fuel cell power plant |
|
|
Hydrogen |
PPH= Amps x (Z.57 x 10-3 ) |
|
Oxygen |
PPH = Amps x (2. 04 x 10-2) |
|
Minimum skin temperature for self-sustaining operation |
+385° F |
|
Minimum skin temperature for recovery in flight |
+360°F |
|
Maximun1 skin temperature |
+500°F |
|
Approximate external -260° to environment temperature range
outside SC (for radiation) |
+400°F |
|
Fuel cell power plant normal operating temperature range |
+385° to +450°F |
|
Condenser exhaust normal operating temperature |
+ 150° to + 175°F |
|
Purging nominal frequency |
Dependent on mission load profile and reactant purity after tank
fill. |
|
O2
purge duration |
2 minutes
|
|
H2 purge duration |
80 seconds |
|
Additional flow rate while purging |
|
|
O2 |
Up to 0.6 lb/hr |
|
H2 |
Up to 0.75 lb/hr (nominal 0.67 lb/hr) |
The cryogenic storage subsystem must be able to meet
the following requirements for proper operation of the fuel cell power
plants and the ECS:
|
Minimum usable quantity |
|
|
Oxygen |
320 lbs each tank (min) |
|
Hydrogen |
28 lbs each tank (min) |
|
Temperature at time of fill |
|
|
Oxygen |
-297°F (approx.) |
|
Hydrogen |
-423°F (approx.) |
|
Operating pressure range |
|
|
Oxygen |
|
|
Normal |
865 to 935 psia |
|
Minimum |
150 psia |
|
Hydrogen |
|
|
Normal |
225 to 260 psia |
|
Minimum |
100 psia |
|
Temperature probe range |
|
|
Oxygen |
-325° to +80° F |
|
Hydrogen |
-425° to -200°F |
|
Maximum allowable difference in quantity balance between tanks |
|
|
Oxygen tanks No. 1 and 2 |
2 to 4% |
|
Hydrogen tanks No. 1 and 2 |
3% |
|
Pressure relief valve operation |
|
|
Crack pressure |
|
|
Oxygen |
983 psig min. |
|
Hydrogen |
273 psig min. |
|
Reseat pressure |
|
|
Oxygen |
965 psig min. |
|
Hydrogen |
268 psig min. |
|
Full flow, maximum relief |
|
|
Oxygen |
1010 psig max. |
|
Hydrogen |
285 psig max. |
Additional data about limitations and restrictions may
be found in the CSM/LM Spacecraft Operational Data Book SNA-8-D-027
The SYSTEMS TEST meter and the alphabetical and
numerical switches, located on panel 101 in the CM LEB, provide a means of
monitoring various measurements within the SC, and verifying certain
parameters displayed only by event indicators. The following can be
measured using the SYSTEMS TEST meter, the respective switch positions,
and the range of each sensor. Normal operating parameters of measurable
items are covered in the telemetry listing.
|
Systems Test Indication (Telemetry Identity and Code No.) |
Switch Positions |
Sensor Range |
|
|
Numerical Select |
Alphabetical Select |
||
|
N2 pressure, psia |
|
|
0 to 75 psia |
|
F/C 1 SC 2060P |
1 |
A |
|
|
F/C 2 SC 2061P |
1 |
B |
|
|
F/C 3 SC 2062P |
1 |
C |
|
|
02 pressure, psia |
|
|
0 to 75 psia |
|
F/C 1 SC 2066P |
1 |
D |
|
|
F/C 2 SC 2067P |
2 |
A |
|
|
F/C 3 SC 2068P |
2 |
B |
|
|
H2 pressure, psia |
|
|
0 to 75 psia |
|
F/C 1 SC 2069P |
2 |
C |
|
|
F/C 2 SC 2070P |
2 |
D |
|
|
F/C 3 SC 2071P |
3 |
A |
|
|
EPS radiator outlet temperature |
|
|
- 50° to +300° F |
|
F/C 1 SC 2087T |
3 |
B |
|
|
F/C 2 SC 2088T |
3 |
C |
|
|
F/C 3 SC 2089T |
3 |
D |
|
|
Battery manifold pressure, psia |
4 |
A |
0 to 20 psia |
|
Batt relay bus CC0232V |
4 |
B |
0 to +45 vdc |
|
LM power |
4 |
D |
|
|
SPS oxidizer line temperature SP 0049T |
5 |
A |
0 to +200°F |
|
CM-RCS oxidizer valve temperature |
|
|
-50° to +50°F |
|
-P engine, sys A CR 2100T |
6 |
B |
|
|
+Y engine, sys B CR 2116T |
5 |
D |
|
|
-P engine, sys B CR 21101 |
5 |
C |
|
|
CW engine, sys B CR 2119T |
6 |
D |
|
|
CCW engine, sys A CR 2114T |
6 |
A |
|
|
- Y engine, sys A CR 2103T |
6 |
C |
|
|
Pwr output |
XPNDR |
A |
>1.0 vdc (nominal) |
|
AGC signal |
XPNDR |
B |
Test >1.0 vdc Operate 0.0 to 4.5 vdc |
|
Phase Lockup |
XPNDR |
C |
Lock ed >4.0 vdc Unlocked <0.8 vdc |
NOTE; Position
7 on the numerical selector switch is an off position.
Conversion of the previously listed measurements to the
SYSTEMS TEST meter indications are listed in the following chart. The
XPNDR measurements are direct readouts and do not require conversion.
COMMAND MODULE INTERIOR LIGHTING
The command module interior lighting system (CM Interior Lighting Diagram)
furnishes illumination for activities in the couch, lower equipment bay
and tunnel areas, and back-lighted panel lighting to read nomenclature,
indicators, and switch positions. Tunnel lighting is provided on SC which
will be concerned with LM activity.
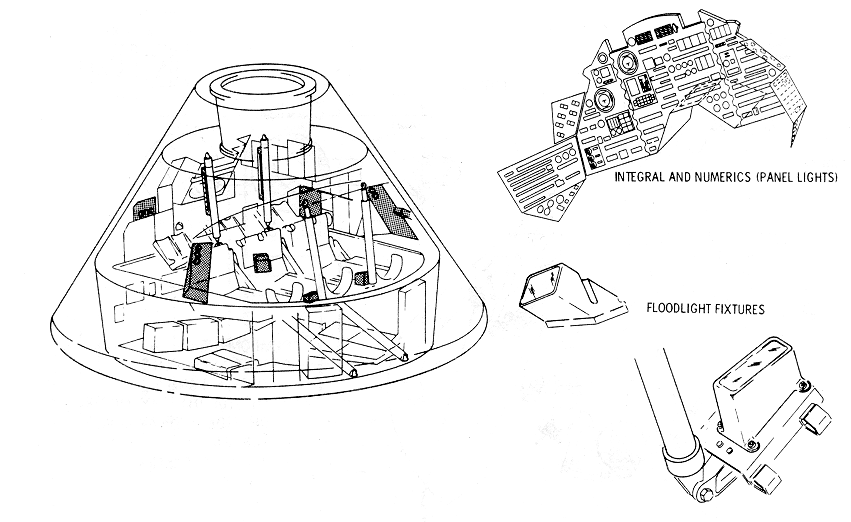
Electroluminescence (EL) is the phenomena whereby light is emitted from
a crystalline phosphor (ZNS)
placed as a thin layer between two closely spaced electrodes of an
electrical capacitor. One of the electrodes is a transparent material.
The light output varies with voltage and frequency and occurs as light
pulses, which are in-phase with the input frequency, : Advantageous
characteristics of EL for spacecraft use are: an "after-glow" of less
than one second, low power consumption, and negligible heat dissipation.
|
Systems Test
Meter Display |
N2,
O2, H2
Pressure (PSIA) |
EPS Radiator
Outlet Temperature (°F) |
CM-RCS Oxidizer
Valve Temperature (°F) |
LM Power (AMPS) |
SPS Temperature
(°F) |
Battery Manifold
Pressure (PSIA) |
Battery Relay
Bus (VDC) |
|
0.0 |
0 |
-50 |
-50 |
0.0 |
0 |
0.00 |
0.0 |
|
0.2 |
3 |
-36 |
-46 |
0.4 |
8 |
0.80 |
1.8 |
|
0.4 |
6 |
-22 |
-42 |
0.8 |
16 |
1.60 |
3.6 |
|
0.6 |
9 |
-8 |
-38 |
1.2 |
24 |
2.40 |
5.4 |
|
0.8 |
12 |
+6 |
-34 |
1.6 |
32 |
3.20 |
7.2 |
|
1.0 |
15 |
+20 |
-30 |
2.0 |
40 |
4.00 |
9.0 |
|
1.2 |
18 |
+34 |
-26 |
2.4 |
48 |
4.80 |
10.8 |
|
1.4 |
21 |
+48 |
-22 |
2.8 |
56 |
5.60 |
12.6 |
|
1.6 |
24 |
+62 |
-18 |
3.2 |
64 |
6.40 |
14.4 |
|
1.8 |
27 |
+76 |
-14 |
3.6 |
72 |
7.20 |
16.2 |
|
2.0 |
30 |
+90 |
-10 |
4.0 |
80 |
8.00 |
18.0 |
|
2.2 |
33 |
+104 |
-6 |
4.4 |
88 |
8.80 |
19.8 |
|
2.4 |
36 |
+118 |
-4 |
4.8 |
96 |
9.60 |
21.6 |
|
2.6 |
39 |
+132 |
0 |
5.2 |
104 |
10.40 |
23.4 |
|
2.8 |
42 |
+146 |
4 |
5.6 |
112 |
11.20 |
25.2 |
|
3.0 |
45 |
+160 |
10 |
6.0 |
120 |
12.00 |
27.0 |
|
3.2 |
48 |
+174 |
14 |
6.4 |
128 |
12.80 |
28.8 |
|
3.4 |
51 |
+188 |
18 |
6.8 |
136 |
13.60 |
30.6 |
|
3.6 |
54 |
+202 |
22 |
7.2 |
144 |
14.40 |
32.4 |
|
3.8 |
57 |
+216 |
26 |
7.6 |
152 |
15.20 |
34.2 |
|
4.0 |
60 |
+230 |
30 |
8.0 |
160 |
16.00 |
36.0 |
|
4.2 |
63 |
+244 |
34 |
8.4 |
168 |
16.80 |
37.8 |
|
4.4 |
66 |
+258 |
38 |
8.8 |
176 |
17.60 |
39.6 |
|
4.6 |
69 |
+272 |
42 |
9.2 |
184 |
18.40 |
41.4 |
|
4.8 |
72 |
+286 |
46 |
9.6 |
192 |
19.20 |
43.2 |
|
5.0 |
75 |
+300 |
50 |
10.0 |
200 |
20.00 |
45.0 |
The interior floodlight system consists of six
floodlight fixture assemblies and three control panels (CM Floodlight Configuration
Diagram). Each fixture assembly contains two fluorescent lamps
(one primary and one secondary) and converters. The lamps are powered by
28 vdc from main d-c buses A and B (CM Floodlight System Schematic).
This assures a power source for lights in all areas in the event either
bus fails, The converter in each floodlight fixture converts 28 vdc to a
high voltage pulsating d-c for operation of the fluorescent lamps.
CM Floodlight
Configuration Diagram
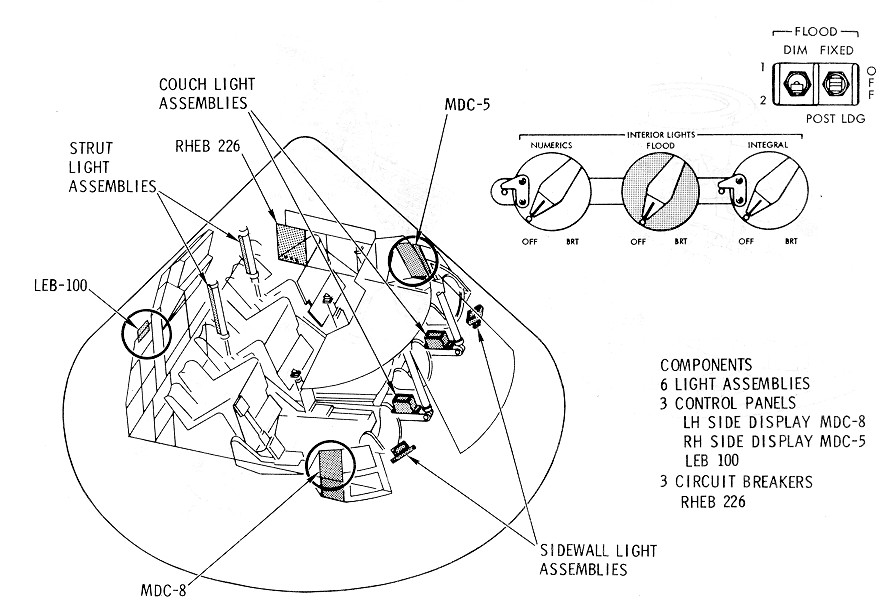
CM Floodlight
System Schematic
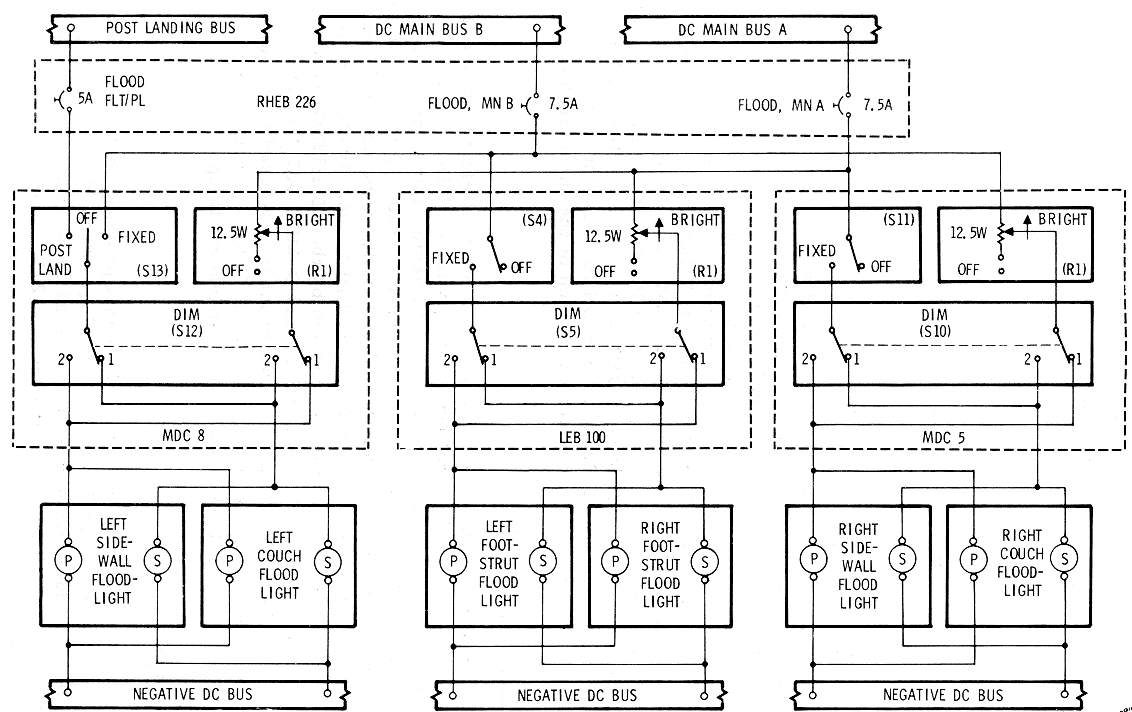
Floodlights are used to illuminate three specific
areas: the left main display console, the right main display console, and
the lower equipment bay. Switches on MDC-8 provide control of lighting of
the left main display console area. Switches on MDC-5 provide control of
lighting of the right main display console area. Switches for control of
lighting of the lower equipment bay area are located on LEB-100.
Protection for the floodlight circuits is provided by the LIGHTING - MN A
and MN B circuit breakers on RHEB-226.
Each control panel has a dimming (DIM-1-2) toggle
switch control, a rheostat (FLOOD-OFF-BRT) control, and an on/off
(FIXED-OFF) toggle switch control. The DIM-1 position provides variable
i11tensity control of the primary flood lamps through the FLOOD-OFF-BRT
rheostat, and on-off control of the secondary lamps through the FIXED-OFF
switch. The DIM-2 position provides variable intensity control of the
secondary lamps through the FLOOD- OFF-BRT rheostat, and on-off control of
the primary lamps through the FIXED-OFF switch. When operating the primary
lamps under variable intensity control (DIM-1 position), turn on of the
lamps is acquired after the F LOOD-OFF-BRT rheostat is moved past the mid
point. In transferring variable intensity control to the secondary lamps,
the FLOOD-OFF-BRT rheostat should first be rotated to the OFF position
before placing the DIM switch to the DIM-2 position. The rheostat is then
moved to the full bright setting and should remain i n this position
unless dimming i s desired. Dimming of the secondary flood l amps should
not be used unless dimming control of the primary floodlights is not
available. Dimming of the secondary lamps results in approximately a
90-percent reduction in l amp life. The range of intensity variation is
greater for the primary tha11 the secondary floodlights.
The commander's control panel (MDC-8) has a POST
LANDINGOFF - FIXED switch which connects the flight and post landing bus
to his floodlights (CM
Floodlight System Schematic). The POST LANDING position
provides single intensity lighting to the commander's primary or secondary
lamps as selected by the DIM-1 or DIM-2 position respectively. It is for
use during the latter stages of descent after main d-c bus power is
disconnected, and during post landing.
The integral lighting system controls the EL lamps
behind the nomenclature and instrument dial faces on all MDC panels, and
on specific panels in the lower equipment bay, left hand equipment bay and
right hand equipment bay (CM Integral/Numerics Illumination
System Diagram
and
Integral and Numerics Panel Lighting Schematic). The
controls (CM
Integral/Numerics Illumination System Diagram) are rotary
switches controlling variable transformers powered through the appropriate
a-c bus. Each rotary control switch has a mechanical stop which prevents
the switch being positioned to OFF. Disabling of a circuit because of
malfunctions is performed by opening the appropriate circuit breaker on
RHEB- 226. The INTEGRAL switch on MDC-8 controls the lighting of panels
viewed by the commander, MDC-1, 7, 8, 9, 15, and the left half of 2. The
INTEGRAL switch on MDC-5 controls the lighting of panels viewed by the L M
pilot, MDC-3, 4, 5 and 6, 16, RHEB-229 and 275, and the right half of
MDC-2. The INTEGRAL switch on LEB-100 controls the lighting of MDC-10,
LEB-100, 101, 122 and the DSKY lights on 140, RHEB-225, 226 and LHEB 306.
Intensity of the lighting can be individually controlled in each of the
three areas.
CM
Integral/Numerics Illumination System Diagram
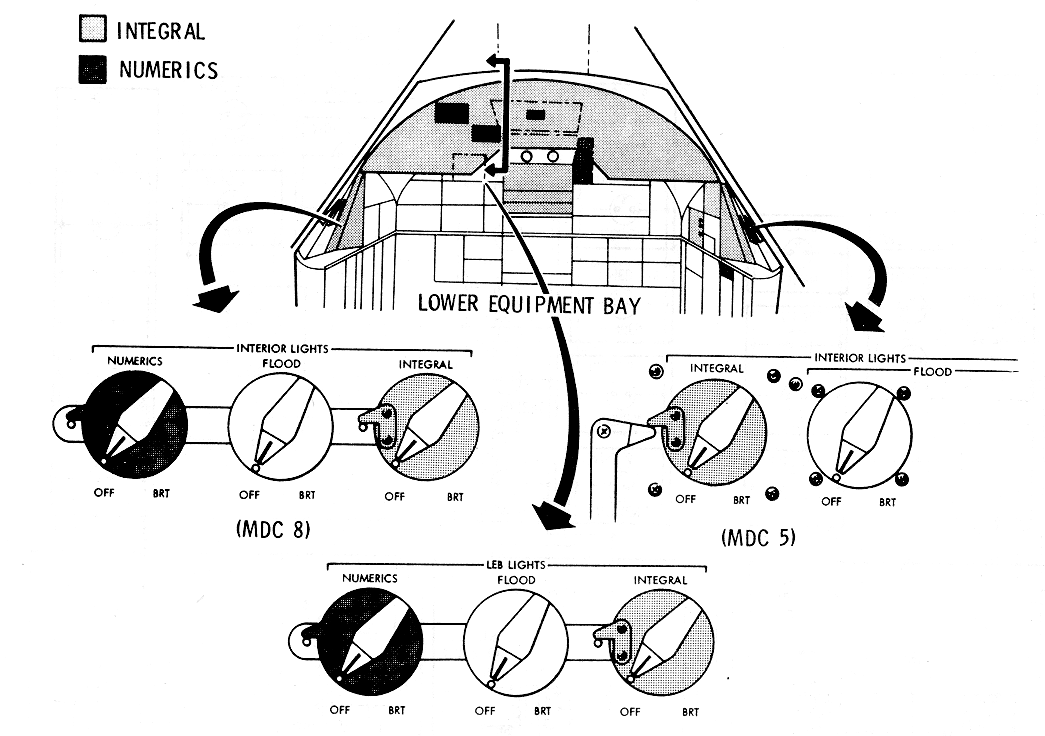
Integral and Numerics Panel Lighting Schematic
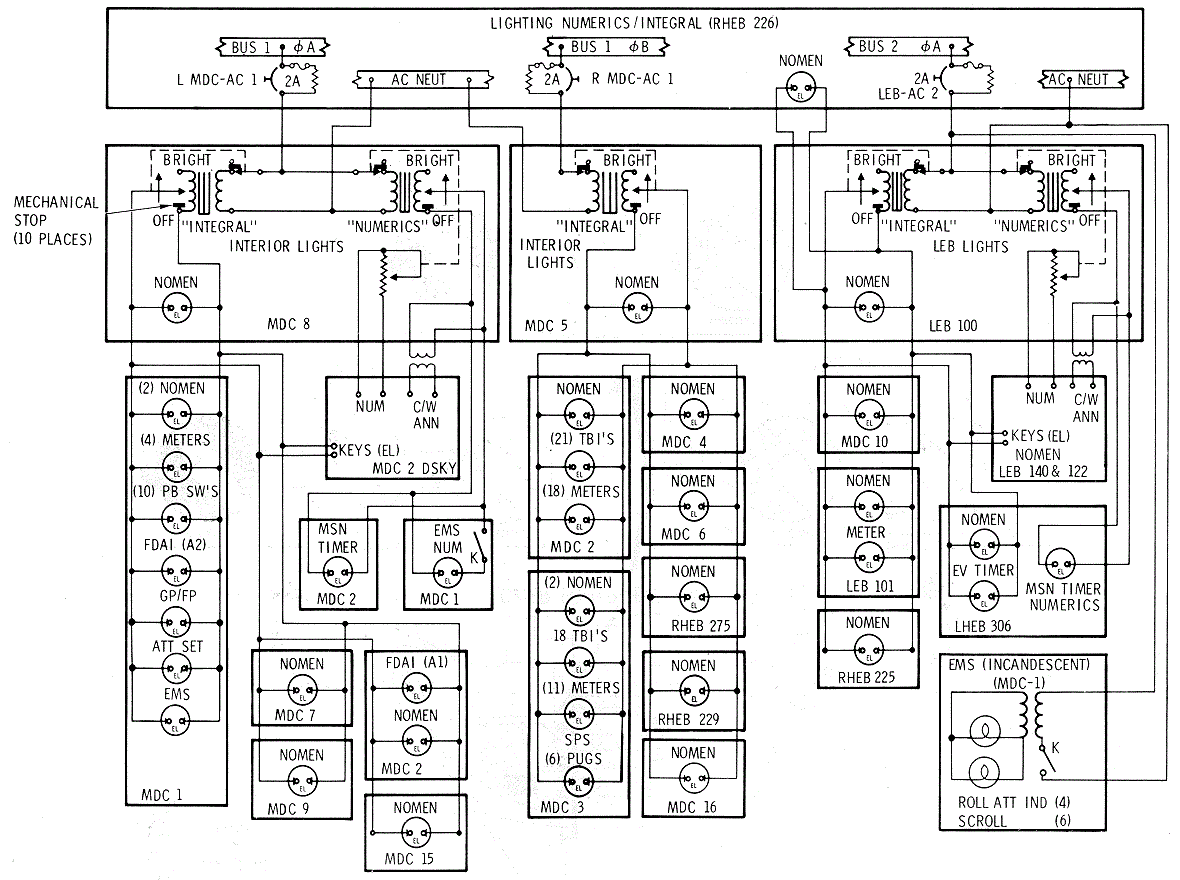
Numerics lighting control is provided over all
electroluminescent digital readouts. The NUMERICS rotary switch on MDC-8
controls the off/intensity of numerals on the DSKY and Mission Timer on
MDC-2, and the range and delta V indicators of the Entry Monitor System of
MDC-1. The switch on LEB-100 controls the off/intensity of the numerals on
t he LEB-140 DSKY and the Mission Timer on LHEB-306. Protection for the
integral and numerics circuits is provided by the LIGHTING-NUMERICS/
INTEGRAL-LEE AC 2, L MDC AC l, and R MDC AC 1 circuit breakers on
RHEB-226. These circuit breakers are used to disable a circuit in case of
a malfunction. The L MDC AC 1 circuit breakers also feed the EMS roll
attitude and scroll incandescent lamps.
The six light fixtures in the CM tunnel provide
illumination for tunnel activity during docking and undocking. Each of the
fixtures, containing two incandescent lamps, is provided 28 vdc through a
TUNNELLIGHTS-OFF switch on MDC-2 (figure 2. 6-21). Main d-c bus A
distributes power to one lamp in each fixture, and main d-c bus B to the
other lamp. Protection is provided by the LIGHTING/COAS/TUNNEL/ RNDZ/SPOT
MN A and MN B circuit breakers on RHEB-226.
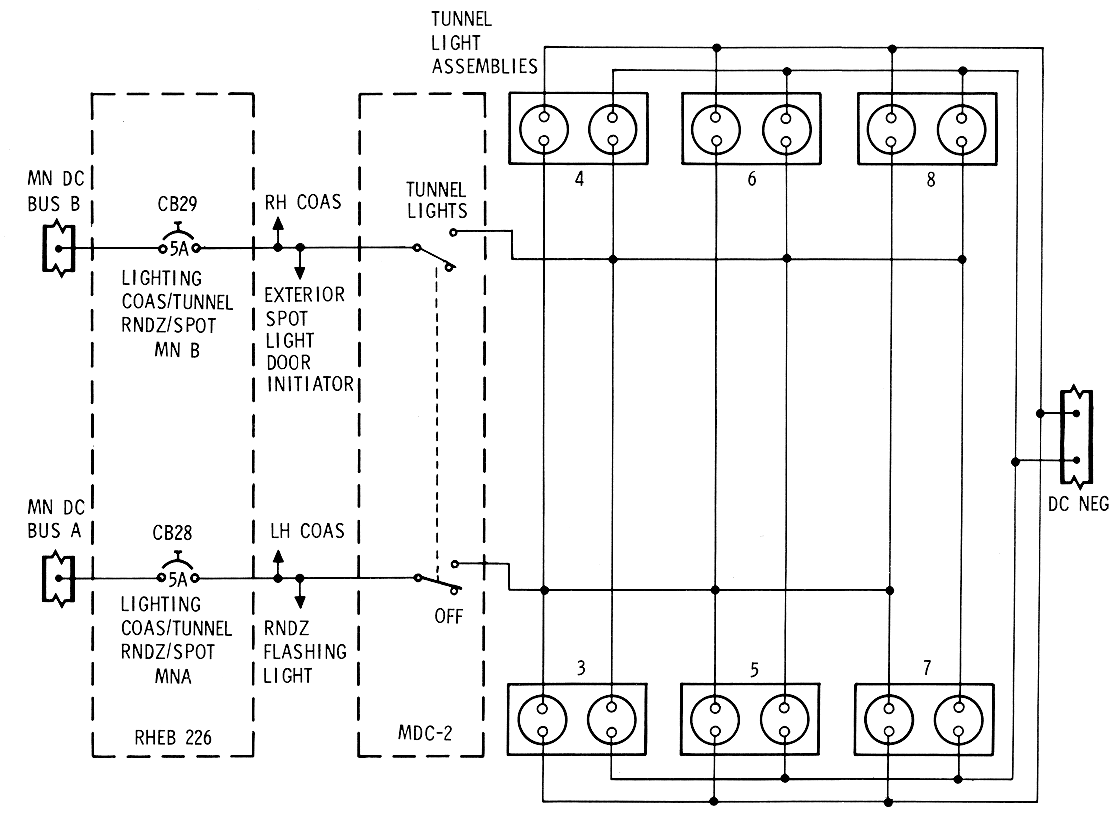
The EV gloves and lunar overshoes (LO) are used for EVA
and lunar exploration. They are aboard the LM at launch and are left
aboard the LM in lunar orbit or jettisoned.